
Claude Code Slow? 12 Fixes for Laggy Responses (2026)
Why is Claude Code so slow? Read the status line, trim context with a lean CLAUDE.md and /clear, switch models with /model, and track the 5-hour limit.
TL;DR
- Most “Claude Code is slow” is context bloat. The spinner status line shows the cost of every turn in seconds and tokens — read it before reaching for a new tool.
- Cut what loads: /init a CLAUDE.md and keep it under 200 lines, /clear between tasks, /compact with a focus when a session must survive.
- Route work to the right engine: /model for a faster default on routine edits, /context to see what is eating the window, fewer MCP servers per project.
- Some slowness is not yours: check status.claude.com for incidents and watch the rolling 5-hour limit — a terminal monitor shows the reset timer and burn rate live.
Wait.. Claude Code is MADE Slow on Purpose? Heres How to Fix It
Channel: AI LABS10:35
Why Claude Code Gets Slow and Forgetful and 4 Habits That Fix It
Channel: Prompt to Prod11:00
Manage costs & usage limits — official documentation
Official docs: code.claude.com/docs
Every command, limit and default on this page is verified against code.claude.com/docs and the anthropics/claude-code changelog; the videos above are the visual and fact sources, including the status-line readouts and the five-hour-window monitor. Where the video and the docs disagreed, the guide follows the docs.
Screenshots are attributed to their creators with deep links to the exact timestamps. No face-cam frames are used.
Make Claude Code fast again, step by step
Part 1 — See where the time goes
- 1
Send one prompt to a fresh session
Launch claude in your project and type a real request. A brand-new session starts with nothing but the welcome box, so Claude must read your files before it can answer — that discovery pass is where most “Claude Code is slow” reports begin. Watch the input area as the spinner verbs change.
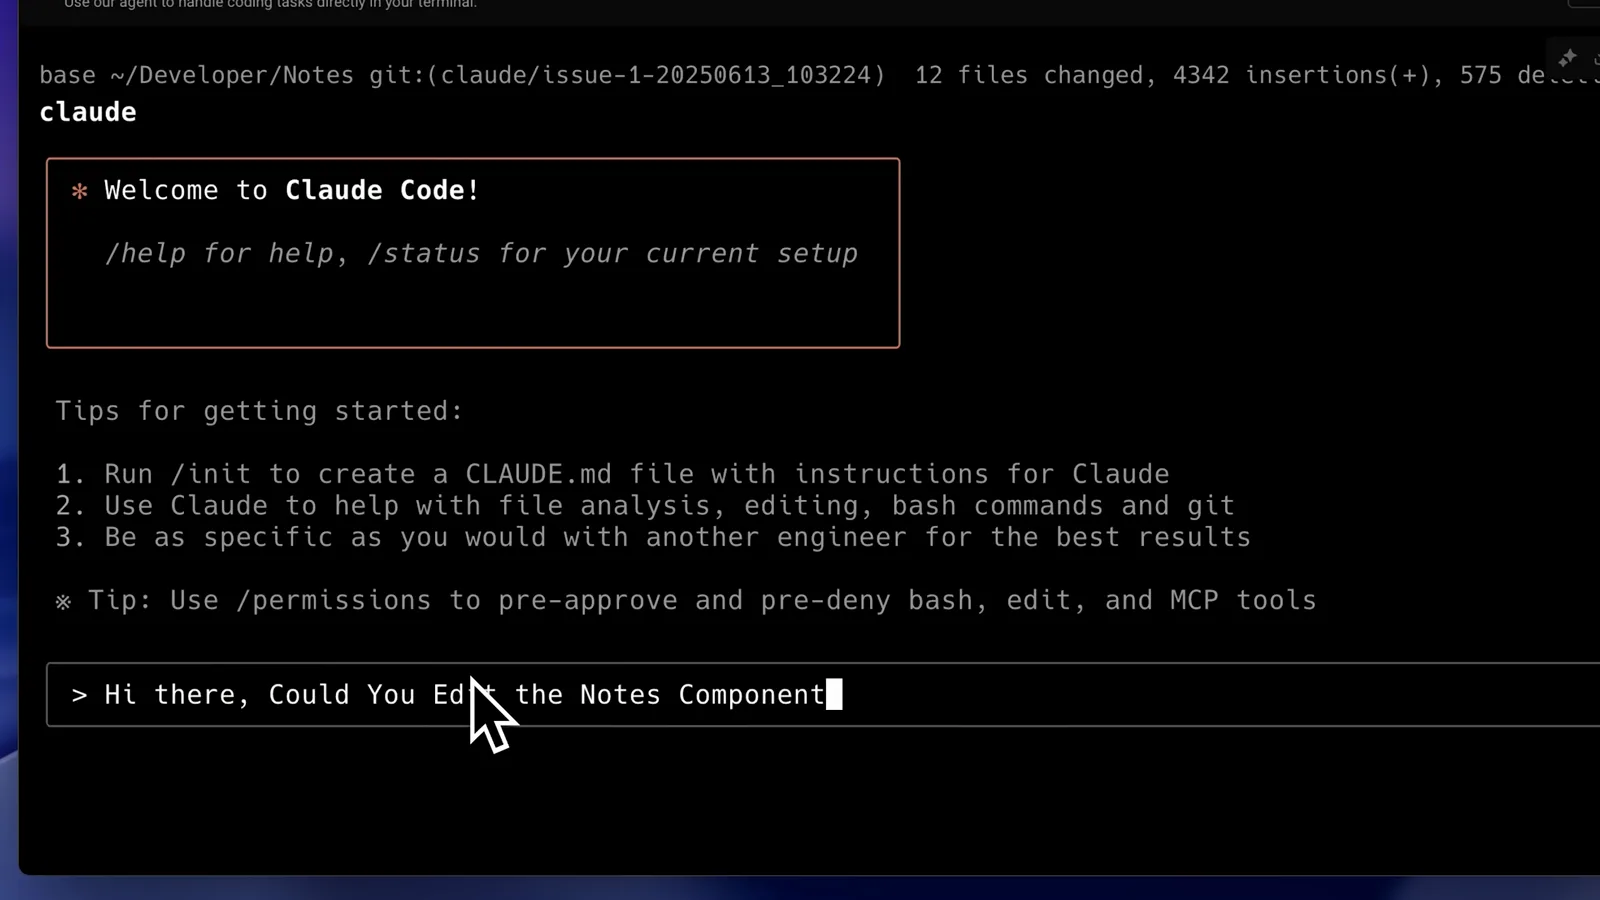
A fresh session: the welcome-box tips are all the context Claude Code starts with.Watch at 0:08 - 2
Read the status line while it works
Under the diff you will find a line like “Unravelling… (16s · 351 tokens · esc to interrupt)”. The verb is decoration; the seconds and token count are your speedometer, telling you whether Claude is thinking, waiting or grinding through files. If every turn burns hundreds of tokens before the first edit, context is doing the slowing.
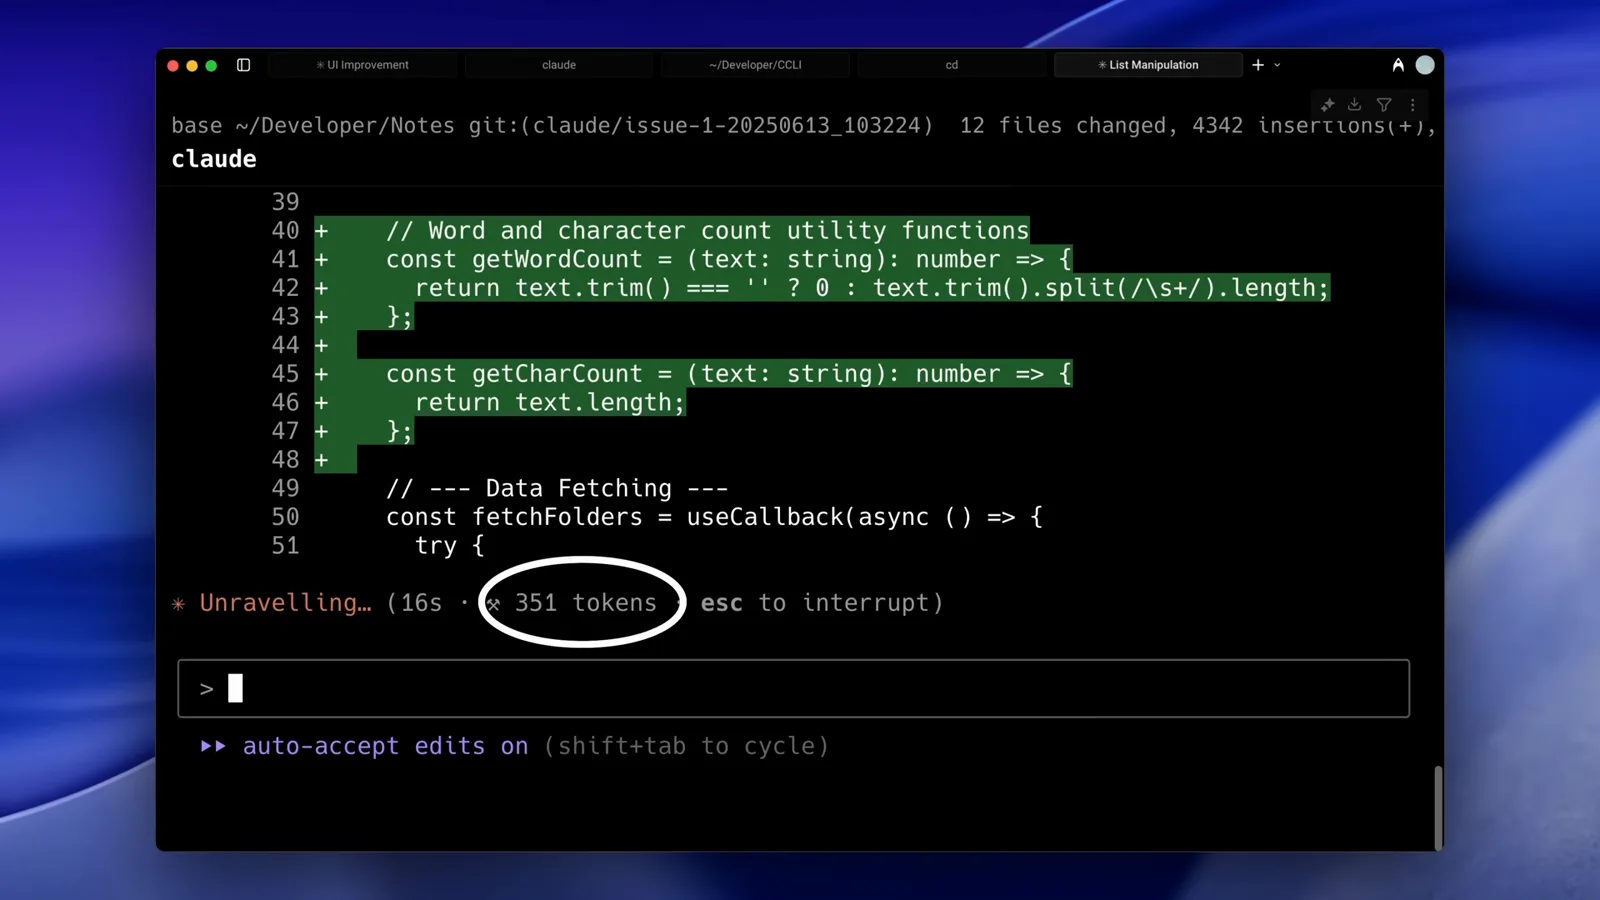
The status line is your speedometer: verb, seconds, tokens, esc to interrupt.Watch at 1:08 - 3
Open the diff and see what one edit dragged in
A small feature still has to be found first. The video’s word-counter edit touches one file with nine additions, yet the turn spends 352 tokens while the spinner settles. In a larger repo that discovery means listing directories and reading files that have nothing to do with your request — the video calls it drowning in unnecessary information.
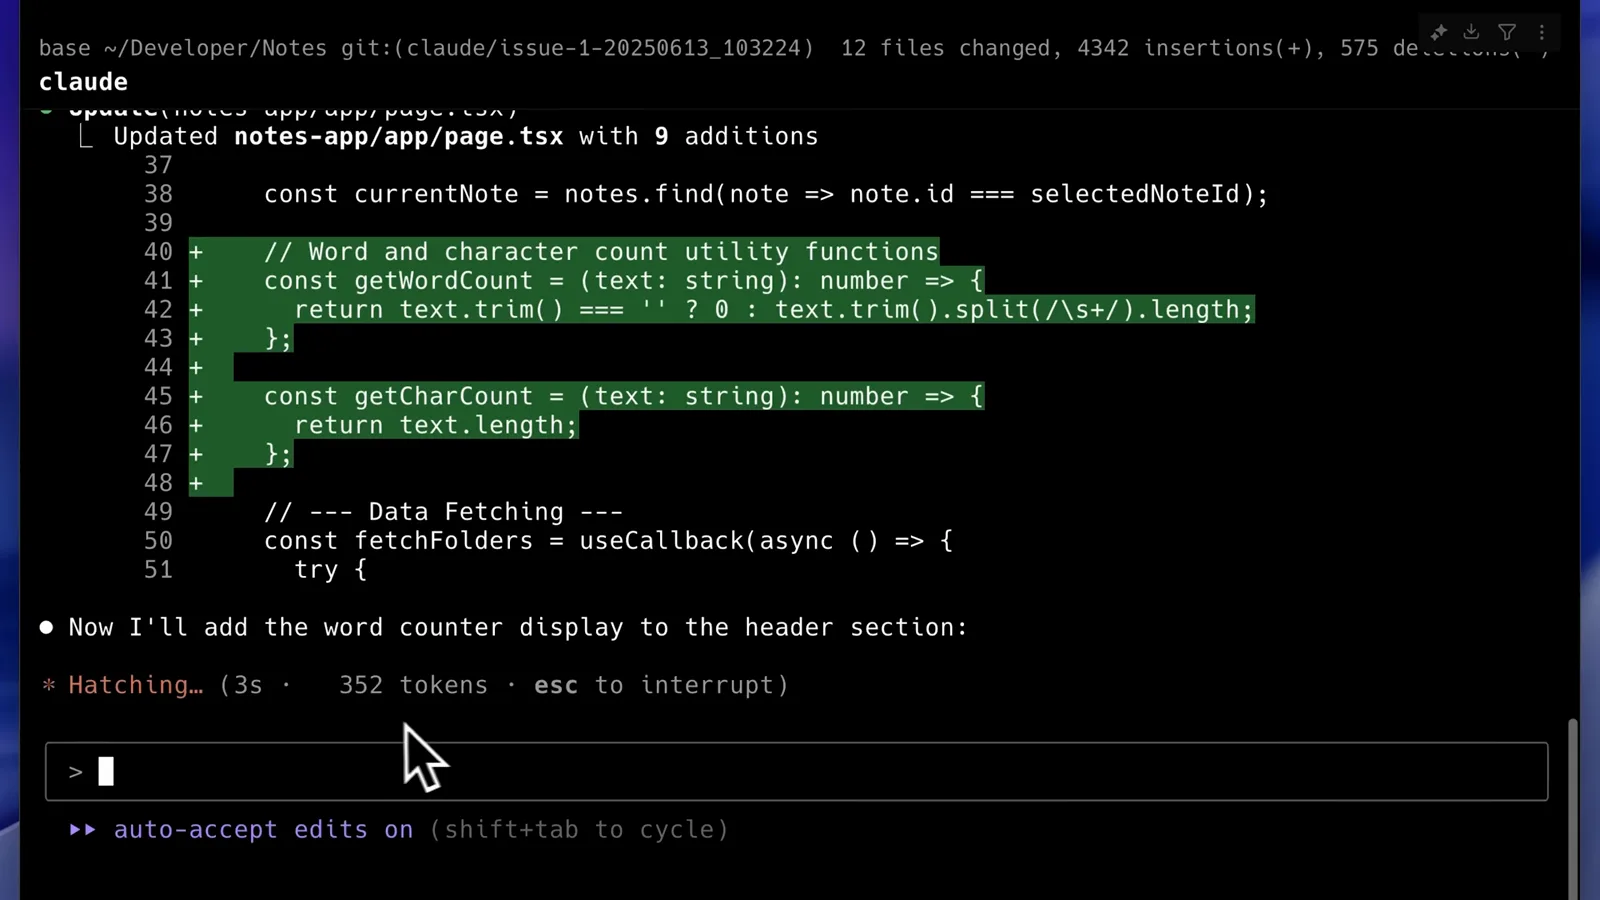
Nine additions to one file — and the spinner keeps counting tokens.Watch at 0:22
Part 2 — Feed it less context
- 4
Run /init to bootstrap CLAUDE.md
Type /init and pick “Initialize a new CLAUDE.md file with codebase documentation”. This is the documented command that gives Claude a persistent brief on your repo, so a fresh session stops re-discovering the project before every edit. It is the single biggest fix for the “it reads everything first” complaint.
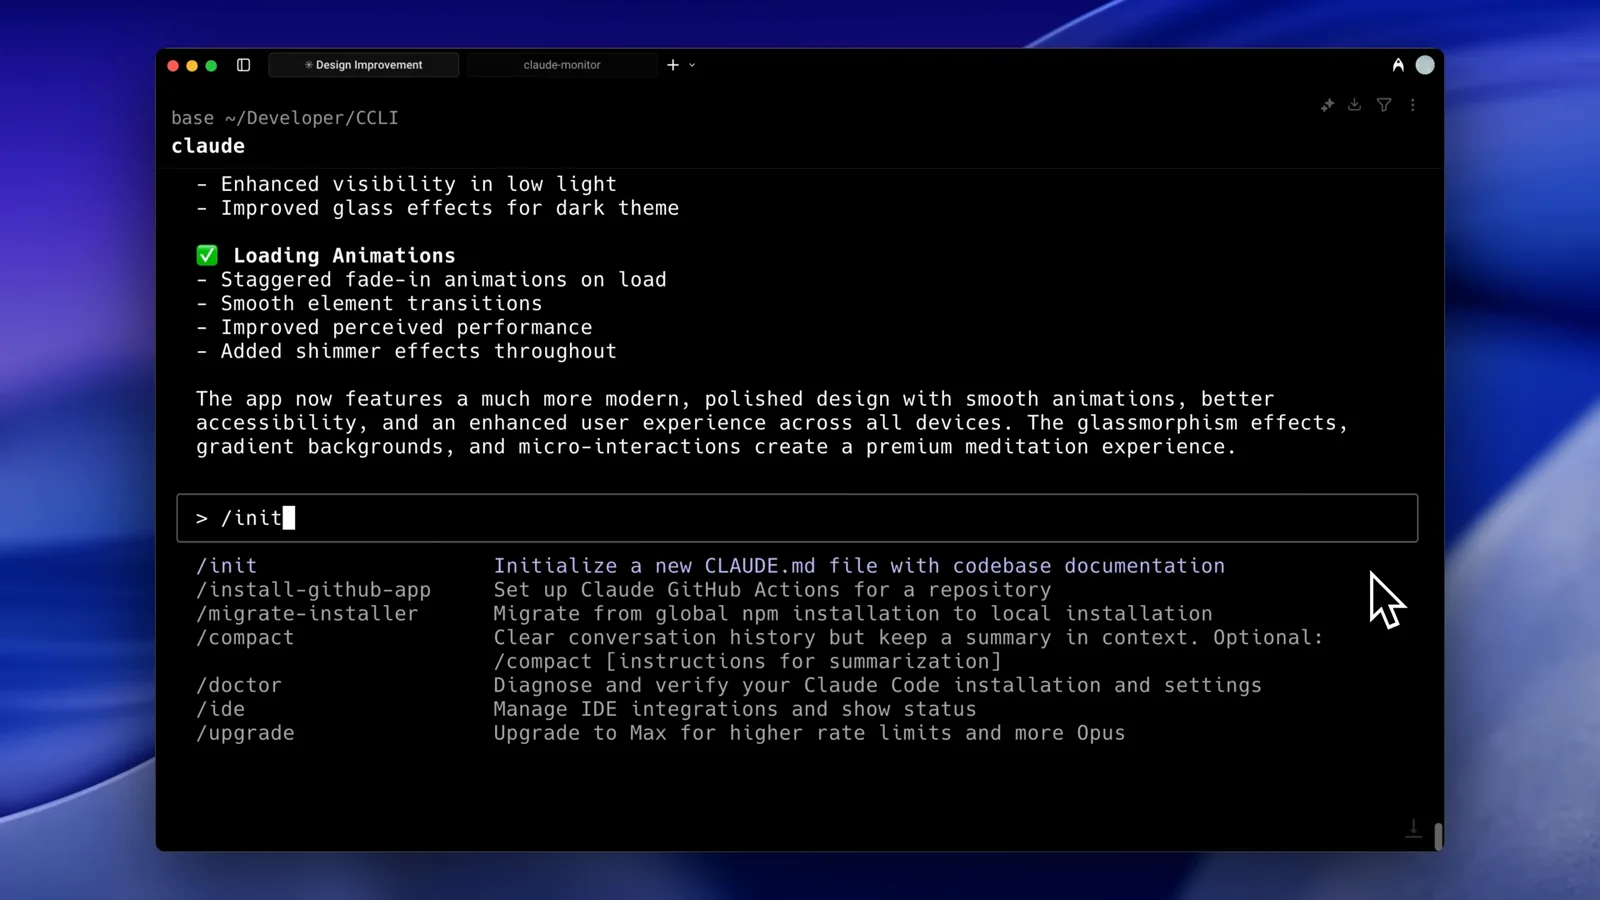
/init is the documented way to bootstrap CLAUDE.md.Watch at 3:38 - 5
Let the one-time scan happen
Claude reads package.json, the README, the router and more, then writes the file — the video’s run shows a Deciphering… spinner after about 90 tokens of tool calls. You pay that cost once. From the next session on, the context Claude needs is already in CLAUDE.md instead of re-read from disk.
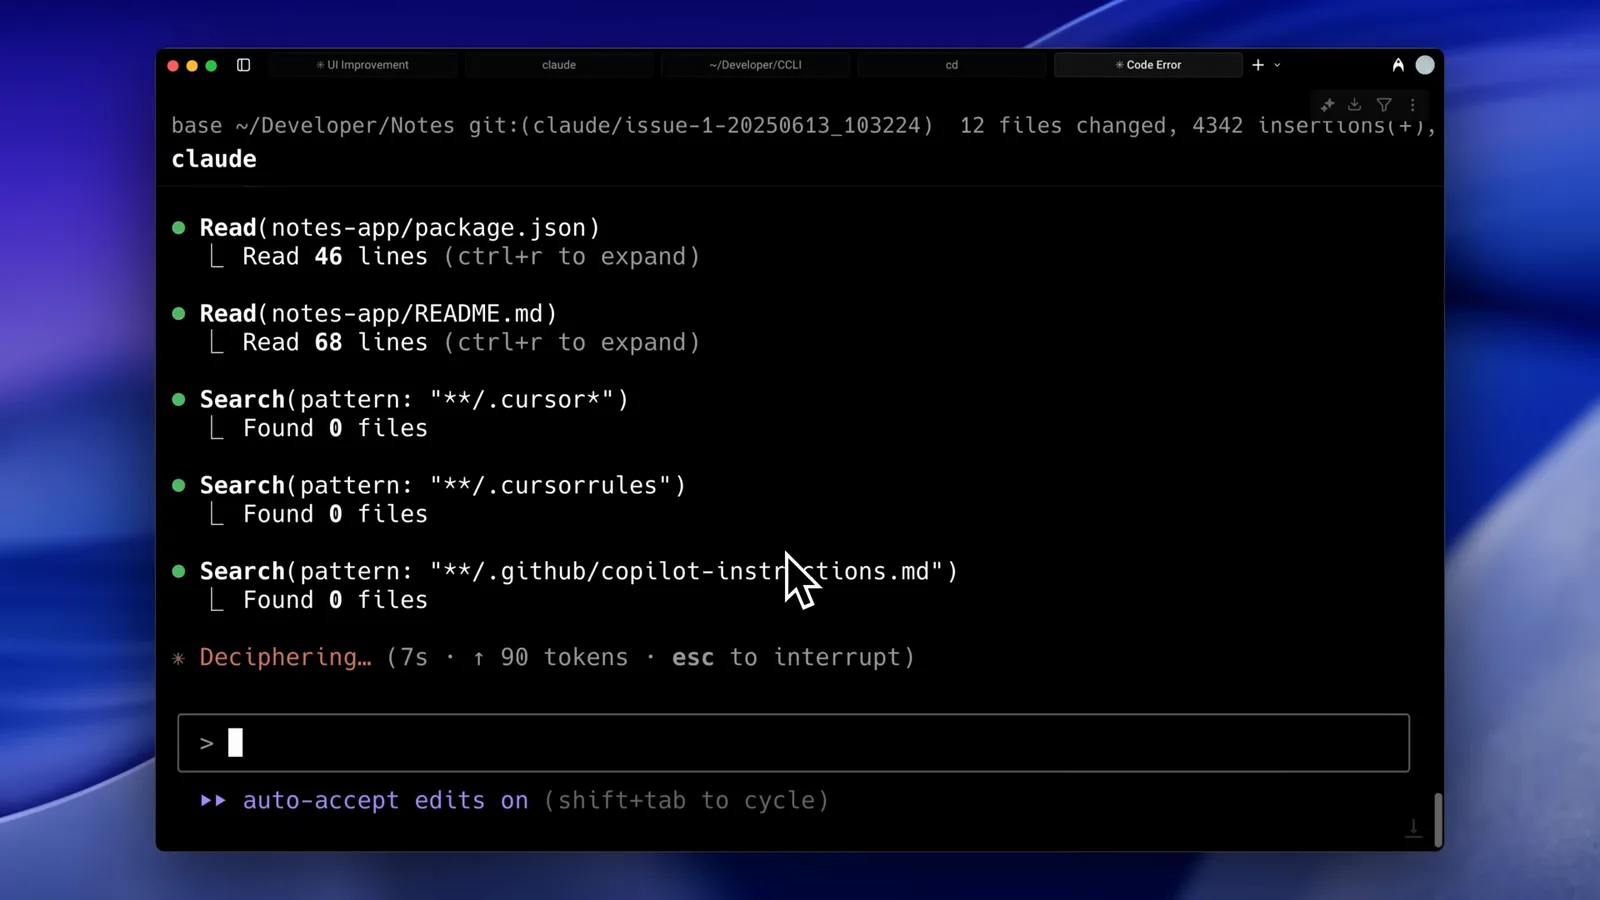
The one-time scan: reads, searches, then the write.Watch at 2:22 - 6
Keep CLAUDE.md lean — commands and architecture
The finished file holds dev commands, the database layer and a short architecture summary. Keep it that way: the official docs say CLAUDE.md loads into context at every session start and recommend under 200 lines. A bloated CLAUDE.md re-creates the problem it solves — move specialized workflows into skills, which load on demand.
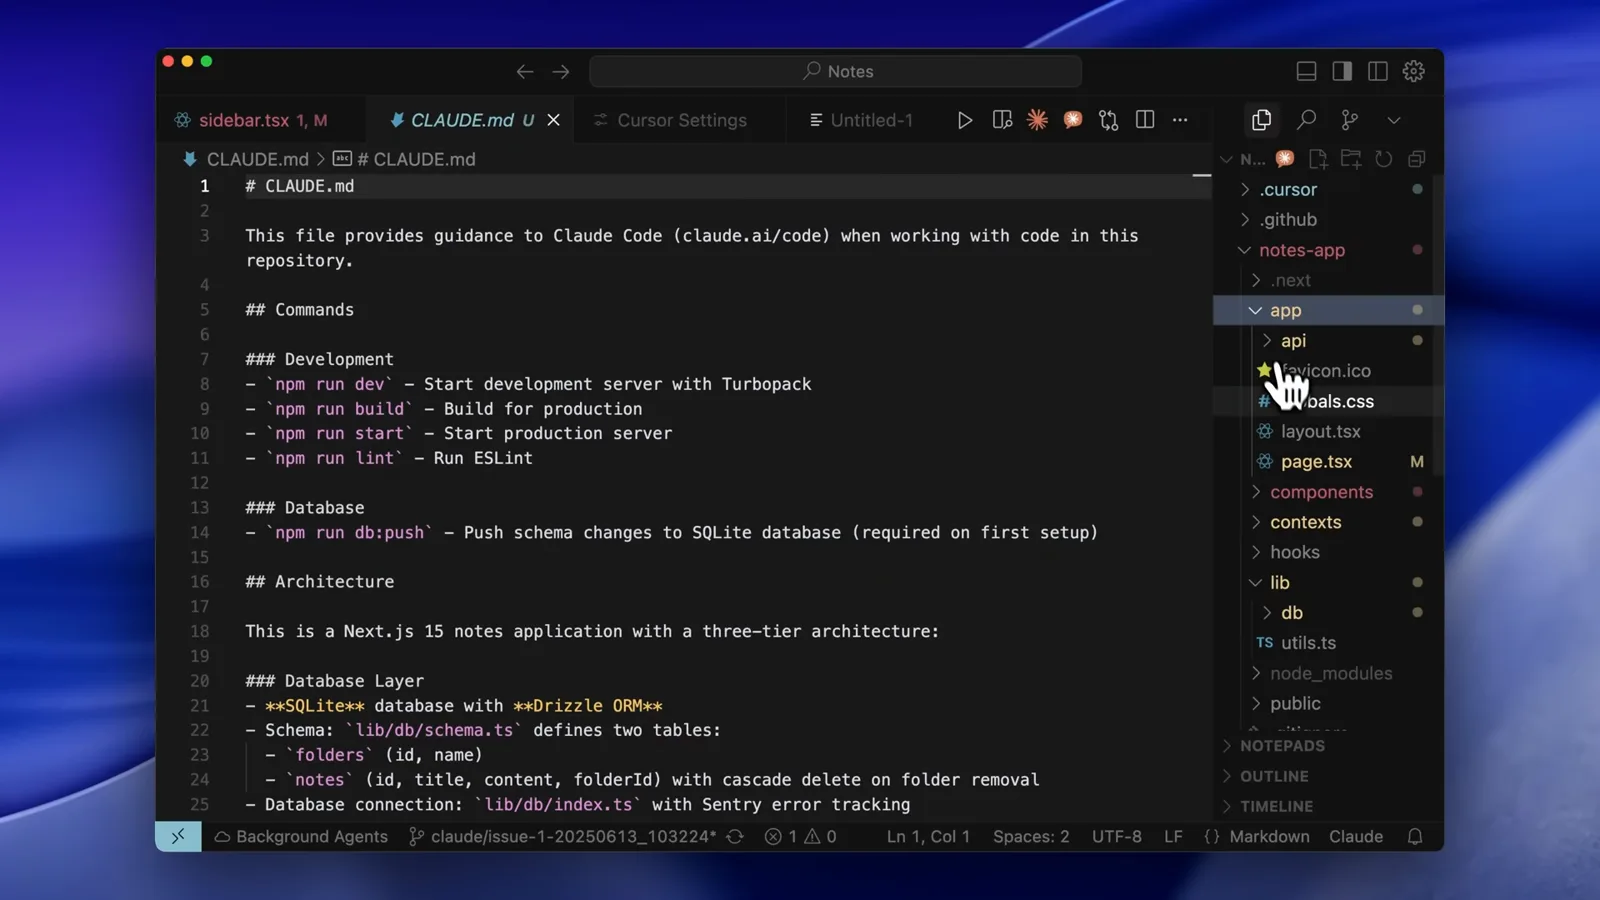
Commands and architecture — the file that loads every session. Keep it short.Watch at 3:50 - 7
Fetch docs by semantic search, not by stuffing context
For library questions the video shows the Context7 MCP calling get-library-docs with a topic — “best practices” — and getting back the one relevant section of Microsoft’s TypeScript repo. Semantic search returns only the pieces that matter instead of pulling whole documentation pages into the window.
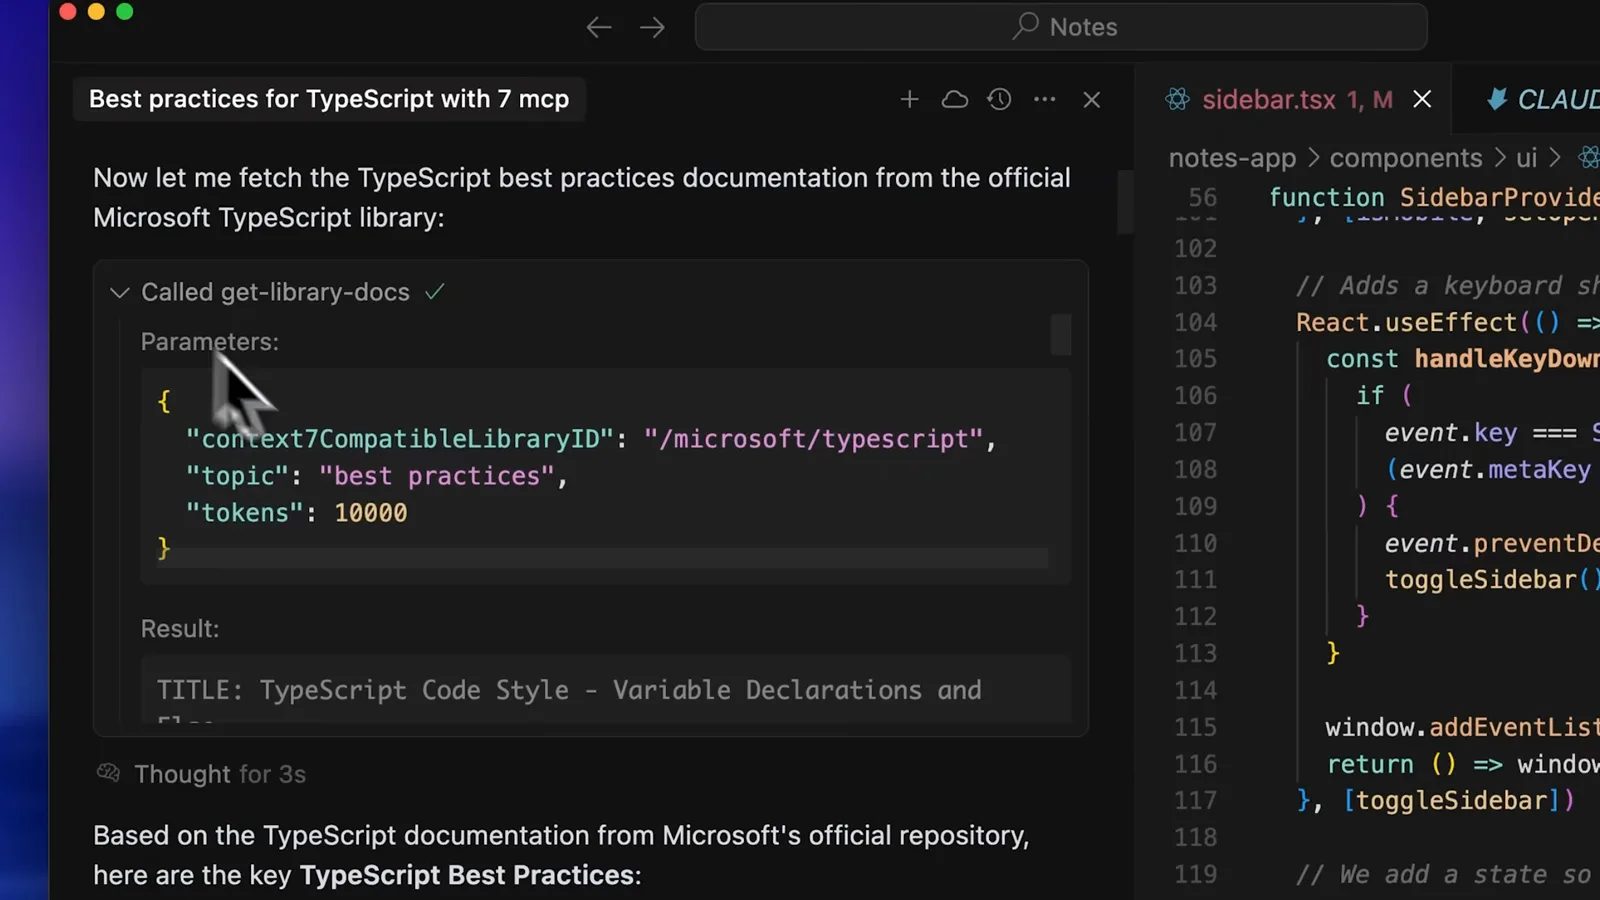
get-library-docs returns the matching section, not the whole manual.Watch at 2:48 - 8
Verify the MCP server with /mcp
Run /mcp and confirm the server shows “connected” — the video adds the Serena semantic-code server with claude mcp add and checks it here. Two caveats from the video and docs: an MCP server is project-scoped, so add it in every repo where you want it, and a server that hangs on startup delays every session in that project.
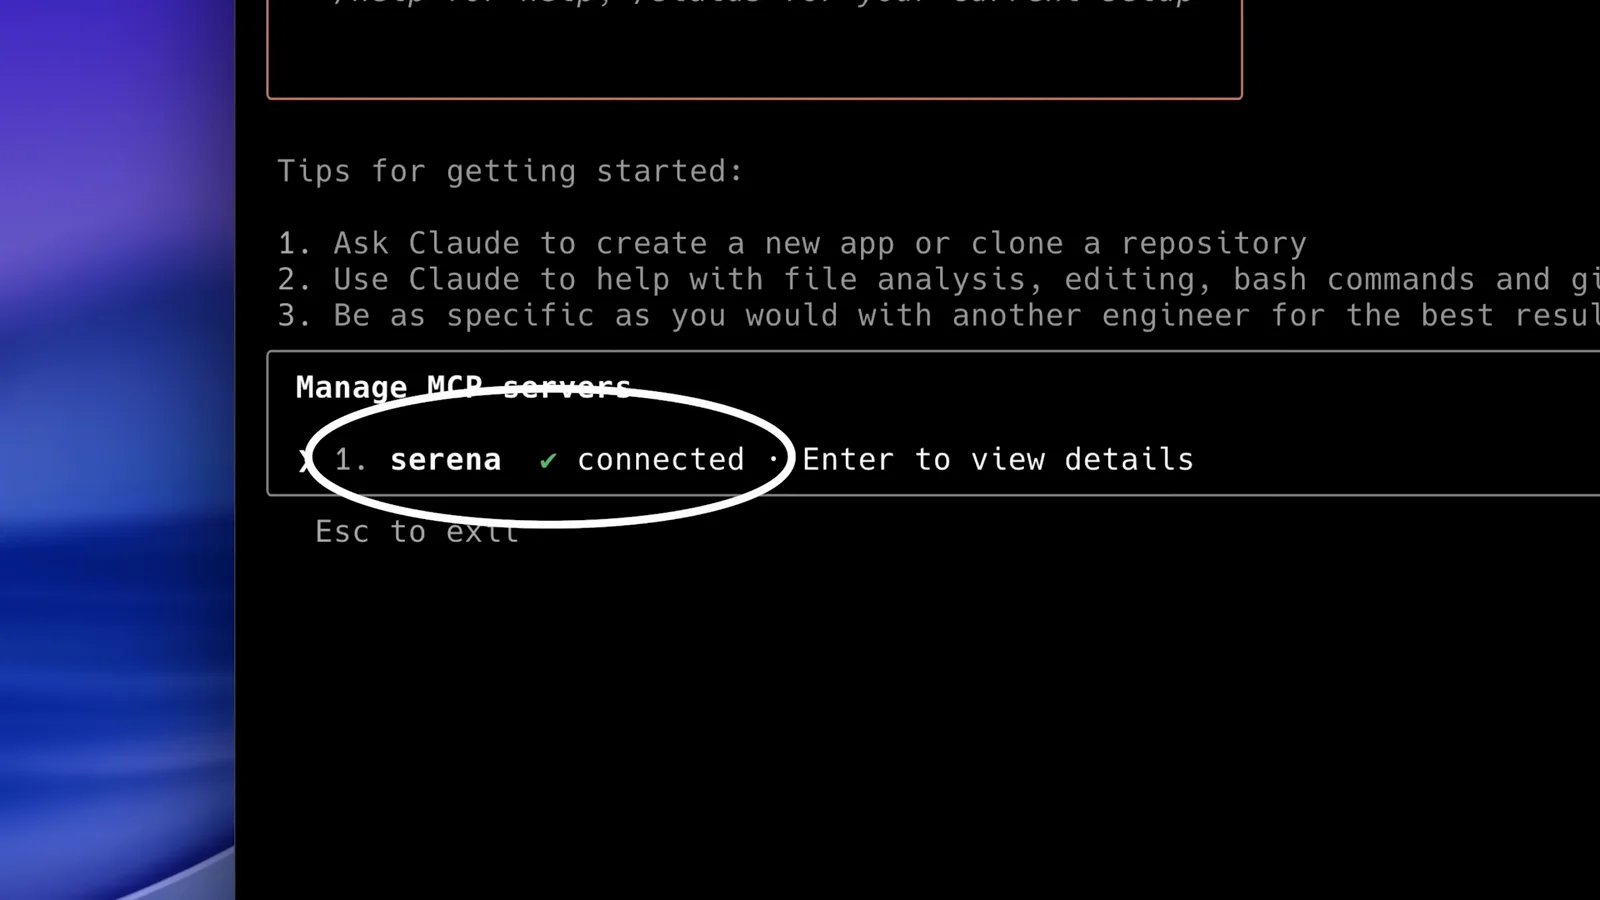
/mcp is where a slow server hides: serena shows a green connected.Watch at 5:31
Part 3 — Models, limits and monitoring
- 9
Pick a faster model for routine work
Open /model — or your IDE’s picker — and match the engine to the job. The official docs recommend Sonnet as the cheaper everyday default and Opus for complex reasoning; simple subagent tasks can run on Haiku. A faster model will not fix a cluttered context, but for small edits it cuts response time and tokens-per-dollar alike.
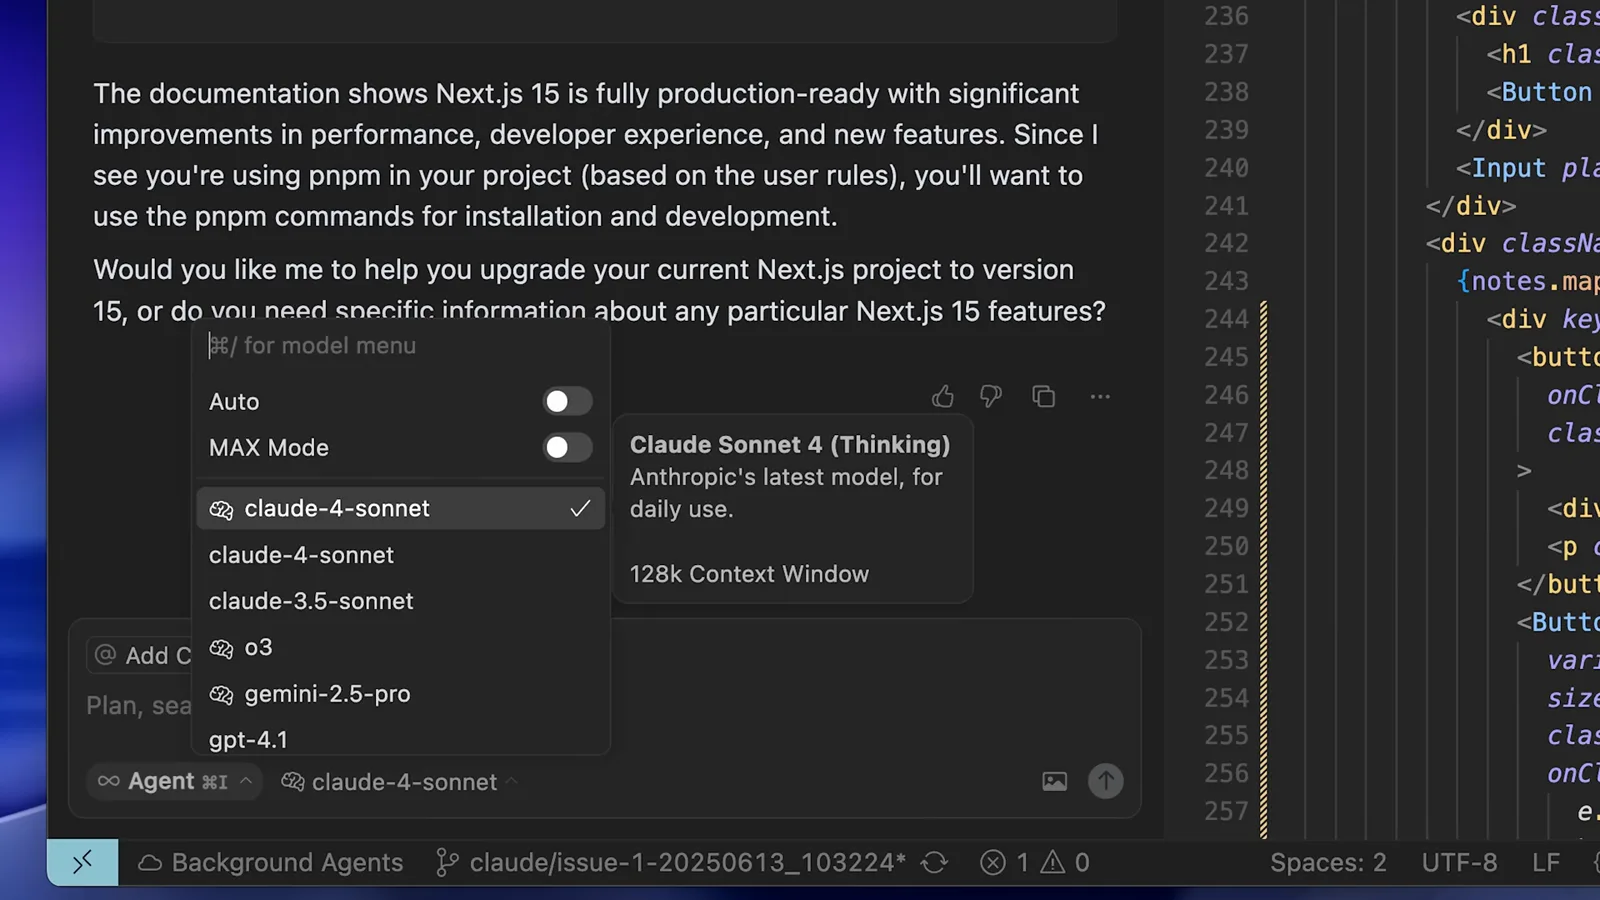
Same prompt, different engine: the picker lives in /model and the IDE toolbar.Watch at 4:32 - 10
Know what happens at your limit
Anthropic’s docs draw a clear line: “You’ve hit your session limit” and weekly-limit messages are seat-based — switching models will not help, and the message shows the reset time. Model-specific limits can be worked around with /model, and from v2.1.234 the /rate-limit-options menu can auto-continue a task after reset.
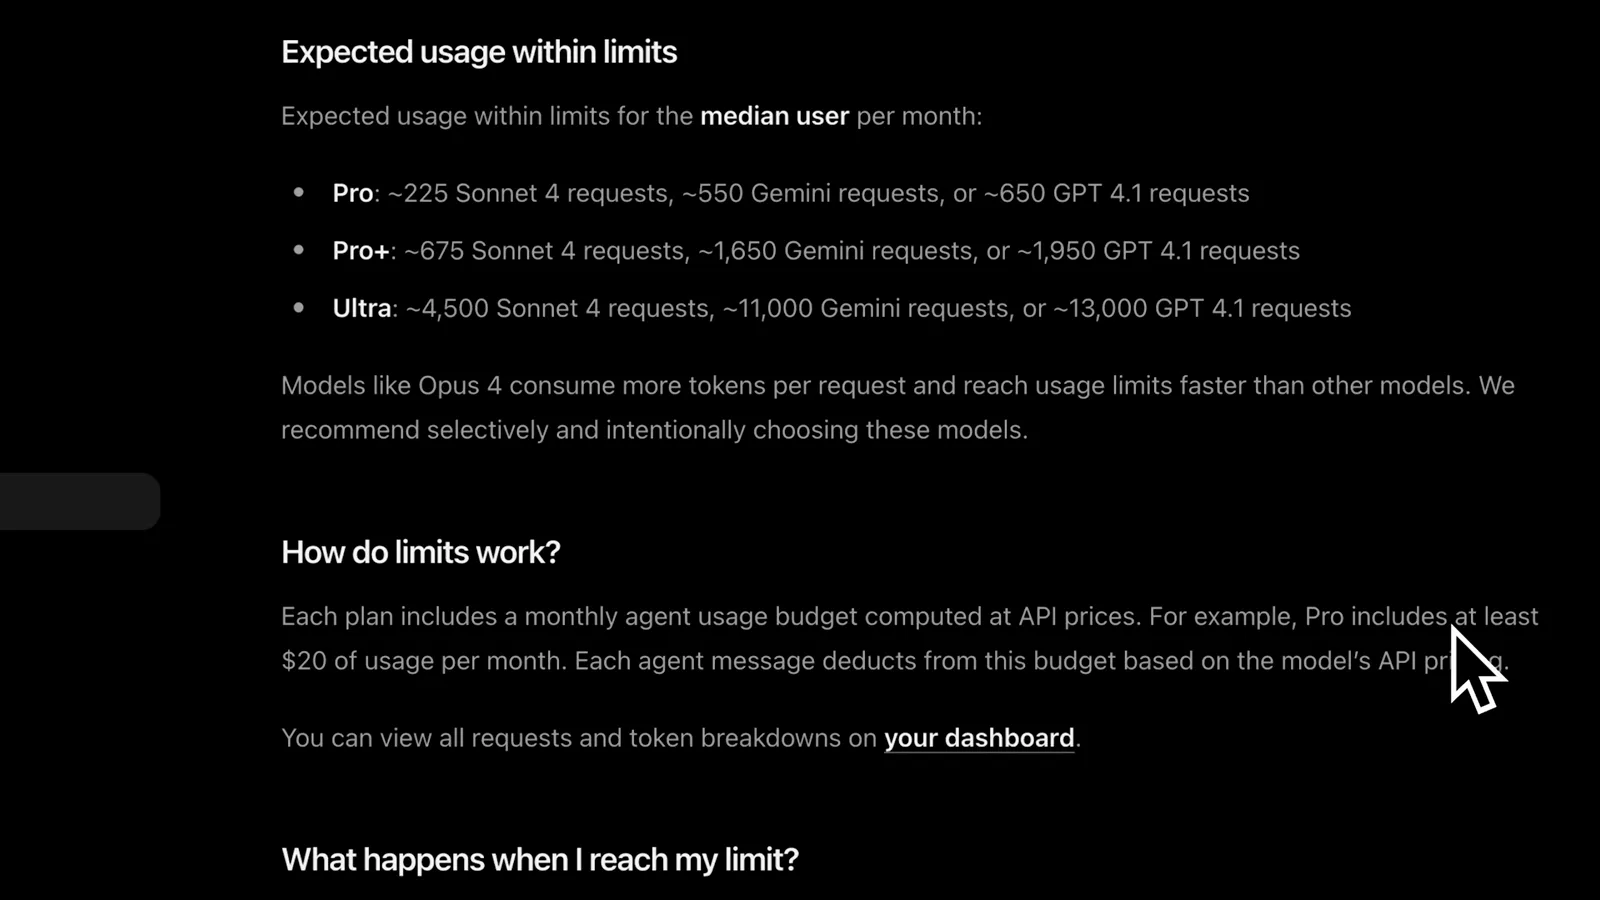
The official answer to “What happens when I reach my limit?”Watch at 4:44 - 11
Track the burn with a terminal monitor
The video recommends the open-source Claude Code Usage Monitor (Maciek-roboblog on GitHub, MIT licensed, installs with uv or pip) and keeps it in a second terminal tab. It reads Claude Code’s own session logs, so usage shows up next to your work — no separate web UI to keep open.
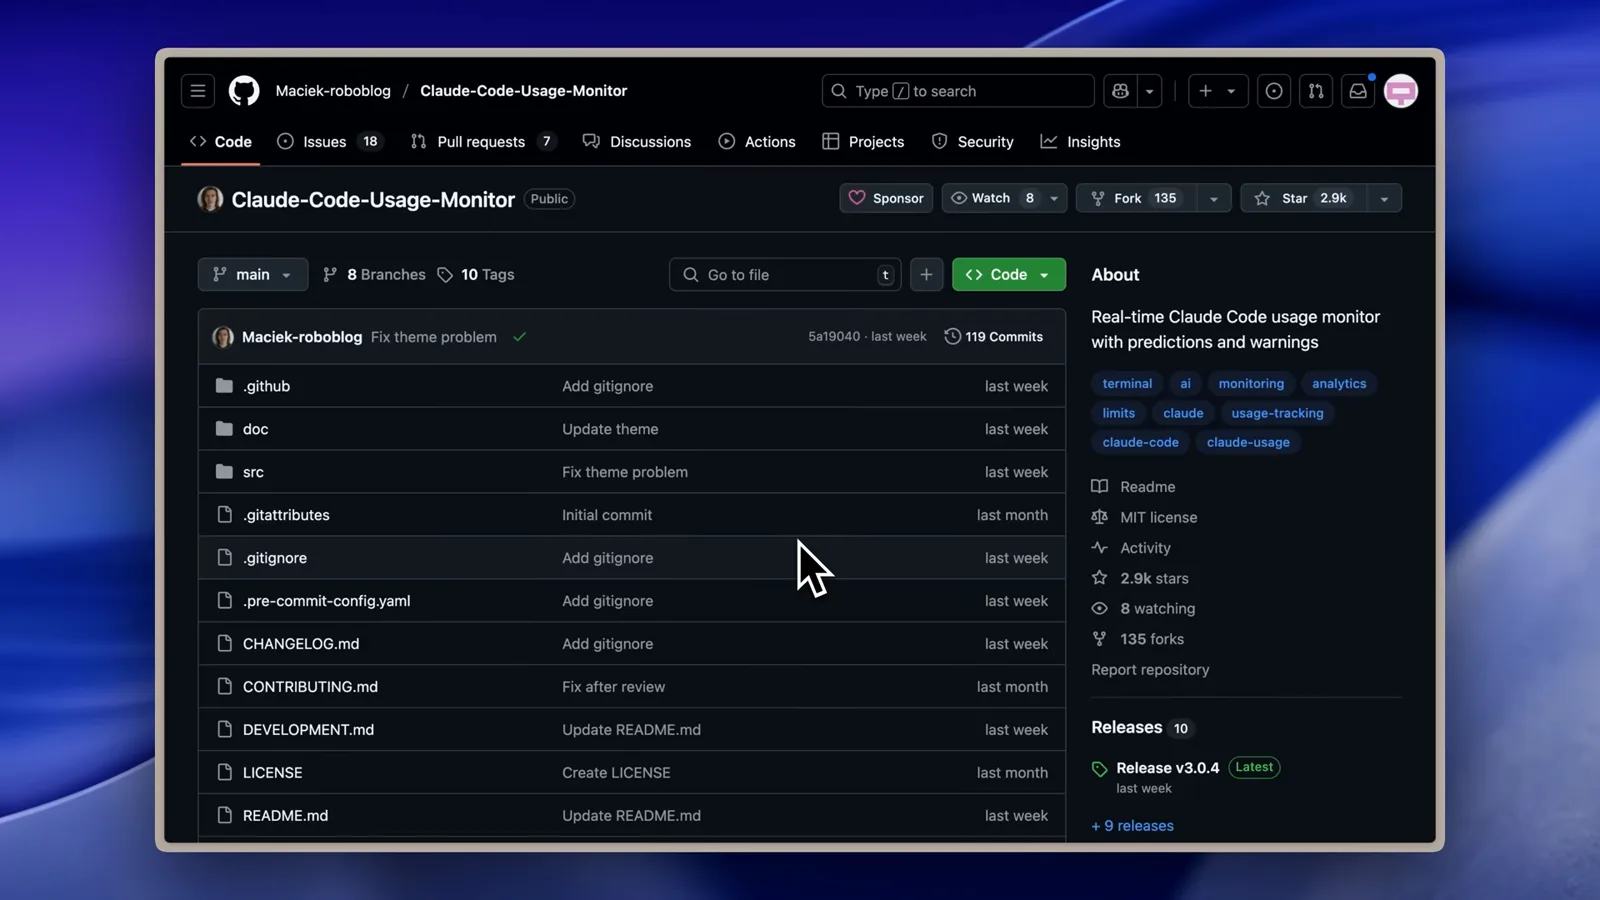
The monitor the video recommends: Maciek-roboblog/Claude-Code-Usage-Monitor.Watch at 6:22 - 12
Watch the reset timer and burn rate
The TUI shows cost, token and message bars, a Time to Reset countdown (2h 52m in the video), model distribution, and a live burn rate with predictions like “Tokens will run out: 3:00 PM”. With the 5-hour window on screen, a sudden slowdown stops being a mystery — you can see the ceiling approaching.
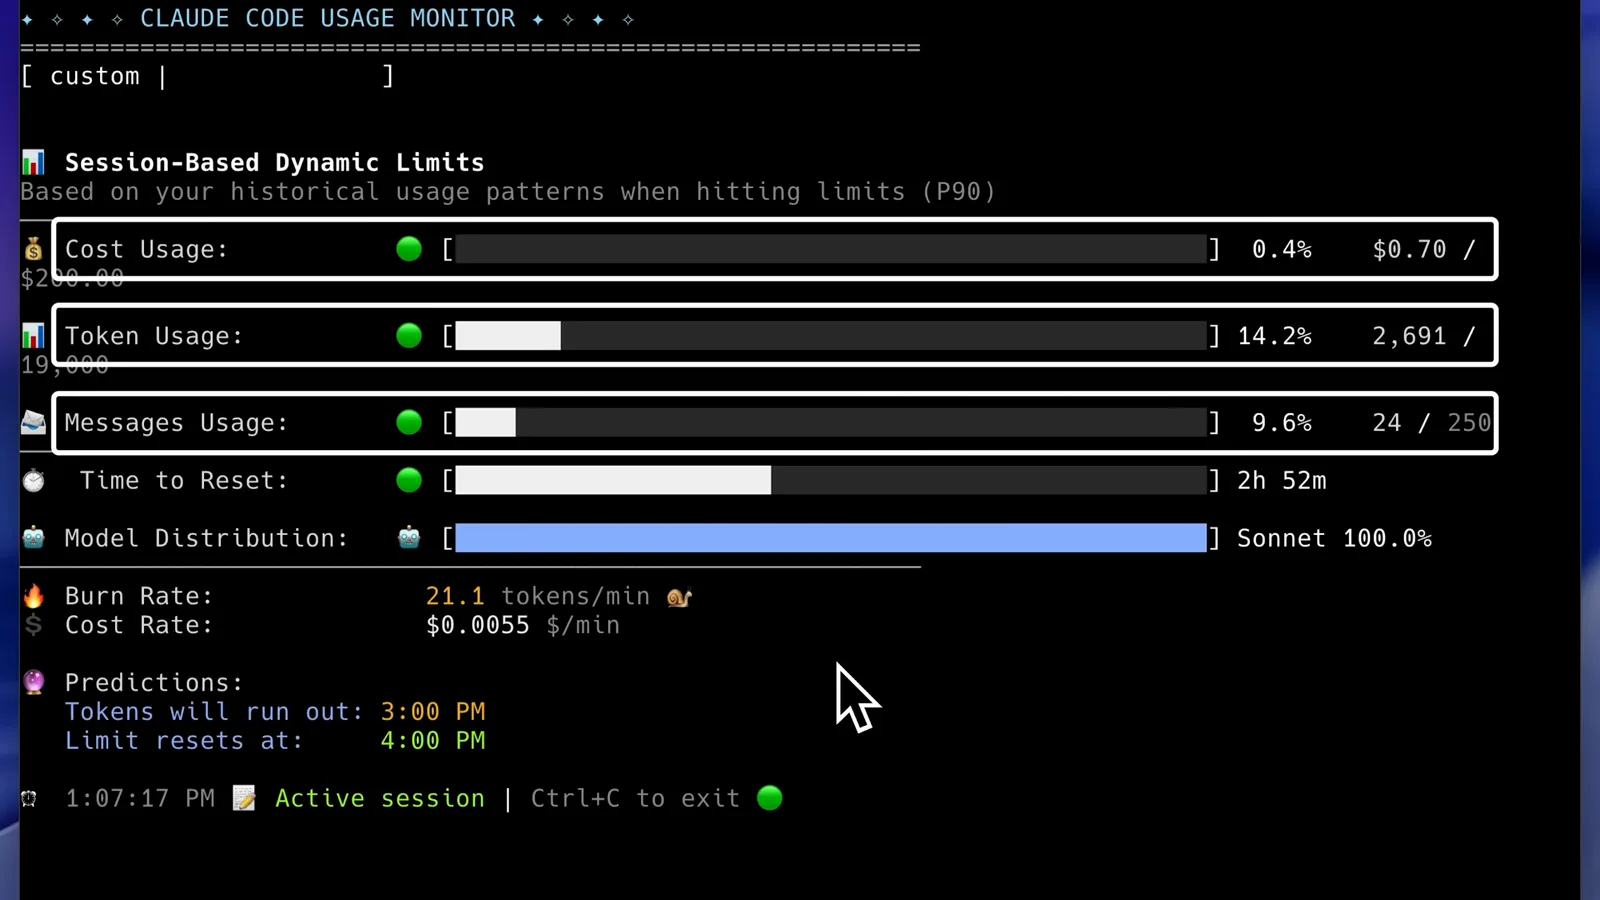
Burn rate and the reset timer, live in a terminal tab.Watch at 6:50
Claude Code vs. Cursor, Codex and last month
The searches “claude code slower than cursor” and “than codex” usually compare different setups, not different engines. What actually differs:
- 1vs Cursor — Cursor ships its own context pipeline and, at the time of the video, capped the model’s window near 120k tokens, while Claude Code gives Claude its full 200k but spends more of it on your repo. Neither is “faster” in general: whichever tool keeps the window leaner feels faster.
- 2vs Codex CLI — same physics. Any coding agent slows when the prompt drags in a whole repo; /clear, a lean context file and focused compacts transfer one-to-one to Codex. Model queues and rate limits differ by plan, not by terminal.
- 3vs Claude Code last month (“slower than before”) — first suspect your own session length, not the release. Long sessions cross the auto-compact threshold and every compaction is a big request; /clear and a two-line re-brief usually restore the old snap. Then check the changelog and run claude --safe-mode to rule out a customization.
- 4vs claude.ai chat — chat feels instant because it does not read your repo. Claude Code trades that startup weight for the ability to act: full context window, local tools, edits on disk. Judge it on task time, not first-token time.
- 5The honest bottom line — raw model latency is similar across the top agents. The differences you can feel are context size, MCP startup, and rate-limit queues — all three are measurable, and all three are fixable on this page.
If you switched tools over speed, run the same task twice — once with /context read before each turn — and compare token counts. Most “this tool is faster” stories are really “this session was smaller”.
Still slow? Work the checklist
Slow has a handful of distinct causes, and each has a tell. Work down this list when the steps above did not explain your lag:
- 1Everything spins today, in every repo → check status.claude.com. Provider incidents show up as long waits and retries everywhere at once; nothing local fixes it, and the status line’s token count stays oddly low while the seconds climb.
- 2An error like “Invalid API key · Please run /login” → that is authentication, not speed, but it stalls sessions the same way. Run /login to re-authenticate; for a stubborn case the docs recommend /logout, closing Claude Code, and starting fresh. Also unset a stray ANTHROPIC_API_KEY — it overrides your subscription login.
- 3Slow only after an hour of work → the context window is full. Auto-compact summarizes older history near the threshold and each compaction is itself a large request. Run /compact with a focus (for example: keep only the plan and the diff) or /clear and paste a two-line re-brief.
- 4Stuck on connecting or MCP startup → run /mcp and look for a server that hangs; remove it from that project. Startup got real fixes recently — v2.1.292 remembers slow stdio servers for 7 days and stopped making headless first turns wait on HTTP servers.
- 5Pauses of minutes that resume on their own → you are meeting the usage limit. Session-limit messages show the reset time; switching models will not help a seat-based limit, but /rate-limit-options (v2.1.234+) can auto-continue the task after reset, and /model helps only for model-specific limits.
- 6The terminal itself lags — slow scrolling, ghost text, delayed typing → that is rendering, not inference. Run claude --safe-mode to disable hooks and statusline scripts for a session; if the lag vanishes, trim your statusline script or hooks. Trying the same session in the VS Code panel versus the terminal isolates it further.
One more from the docs: if a session’s memory passes 2.5GB, restart it — claude --continue resumes the conversation in a fresh process, usually faster than the one you left.