
How to Use Claude Artifacts: A Step-by-Step Tutorial
A complete walkthrough of Kevin Stratvert's 12-minute Claude Artifacts tutorial: build an interactive dashboard from a CSV, refine it with chat prompts, fix details with the annotation tool, then add built-in AI, saved data, connectors, and Live Artifacts. 14 steps, each with a real screenshot.
The short version
- Artifacts are interactive mini-apps — dashboards, tools, games — that Claude builds from a plain-language description. A free Claude account is enough to start.
- Upload a CSV and Claude delivers a working dashboard with hoverable charts in about a minute; every change after that is just another chat prompt, no code.
- The annotation tool fixes one exact element; sharing is a one-click "anyone with the link" URL, and pinning keeps your favorite artifacts at the top of the library.
- Artifacts can also call Claude itself, remember data between sessions, reach Slack or Trello through MCP connectors — and Live Artifacts in the desktop app keep themselves up to date.
How to Use Claude Artifacts (Full Tutorial)
Channel: Kevin Stratvert · 12:42
About the screenshots
All screenshots in this guide are captured from the video above and remain the property of Kevin Stratvert. Each step links back to the exact moment it happens in the video. The step-by-step text, captions, and FAQ are our own writing.
Build a dashboard from a CSV (steps 1–10)
- 1
Open the Artifacts library
Sign in at claude.ai — a free account works — and click Artifacts in the left sidebar. The All and Yours tabs list everything you've created, Shared with you collects artifacts other people sent you, and the search box filters the whole library.
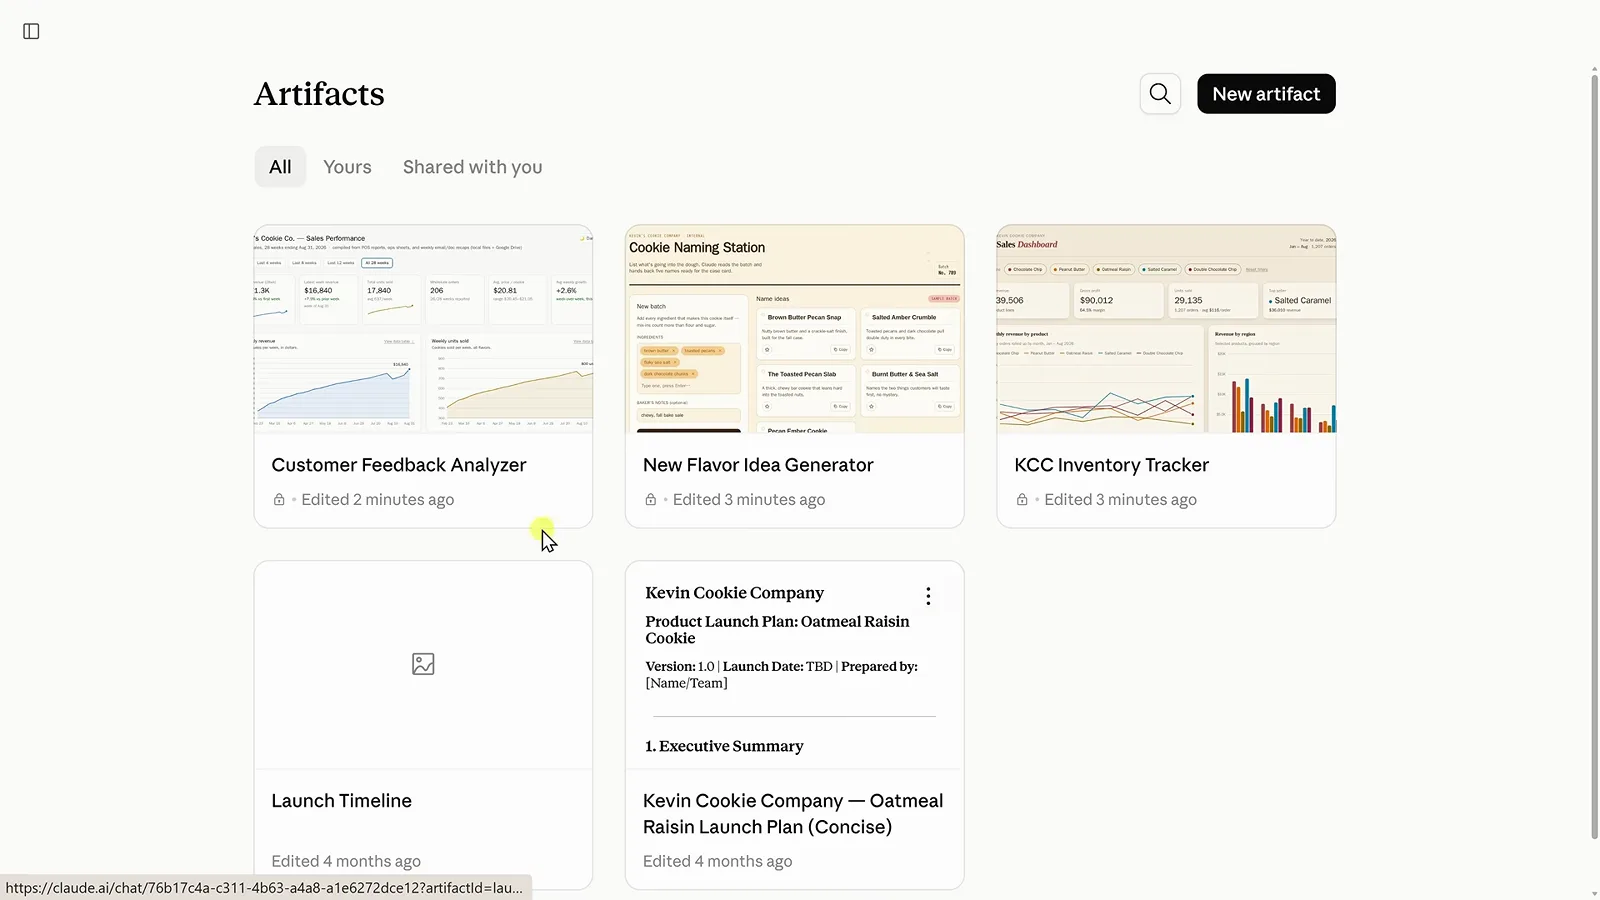
The Artifacts hub: All, Yours, and Shared with you tabs, with New artifact in the corner.Watch at 0:50 - 2
Click New artifact
Hit the New artifact button in the top-right corner. Claude opens a fresh task and, instead of building blindly, interviews you first. It calls the artifact a "web page" — that's just the foundation it builds on, whatever you end up making.
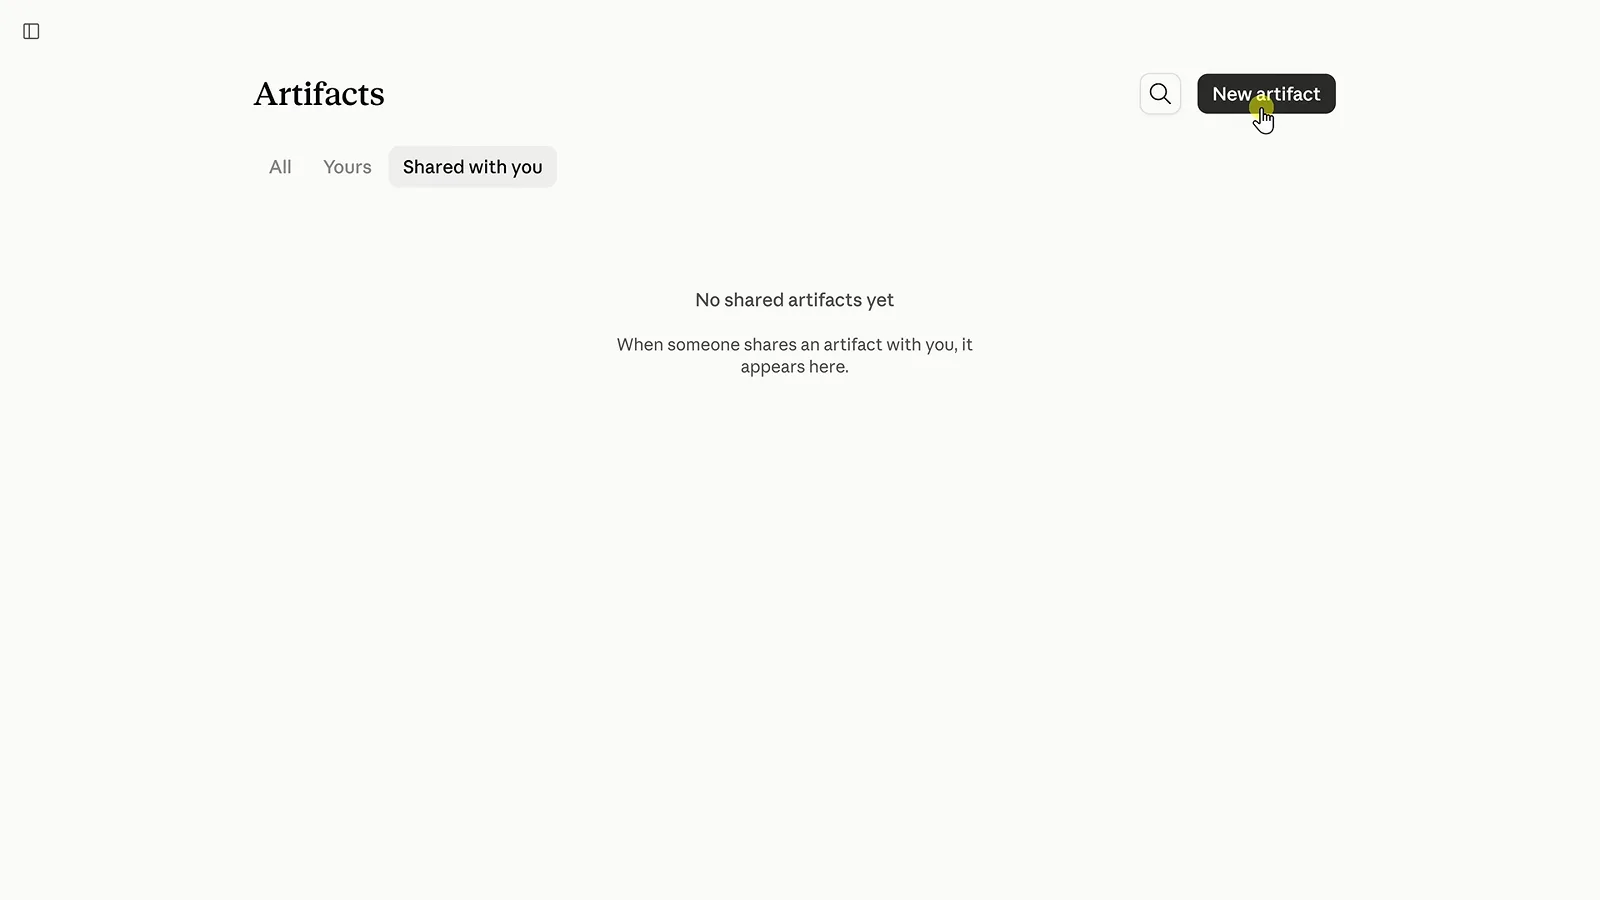
One click starts a guided task — questions come before code.Watch at 1:02 - 3
Answer the kickoff questions
For this dashboard we pick Dashboard, the Bold & colorful style, and Sales & revenue trends as the focus. Your questionnaire may look slightly different — that's fine. Answer whatever is relevant, or skip the questions and describe everything yourself in one message.
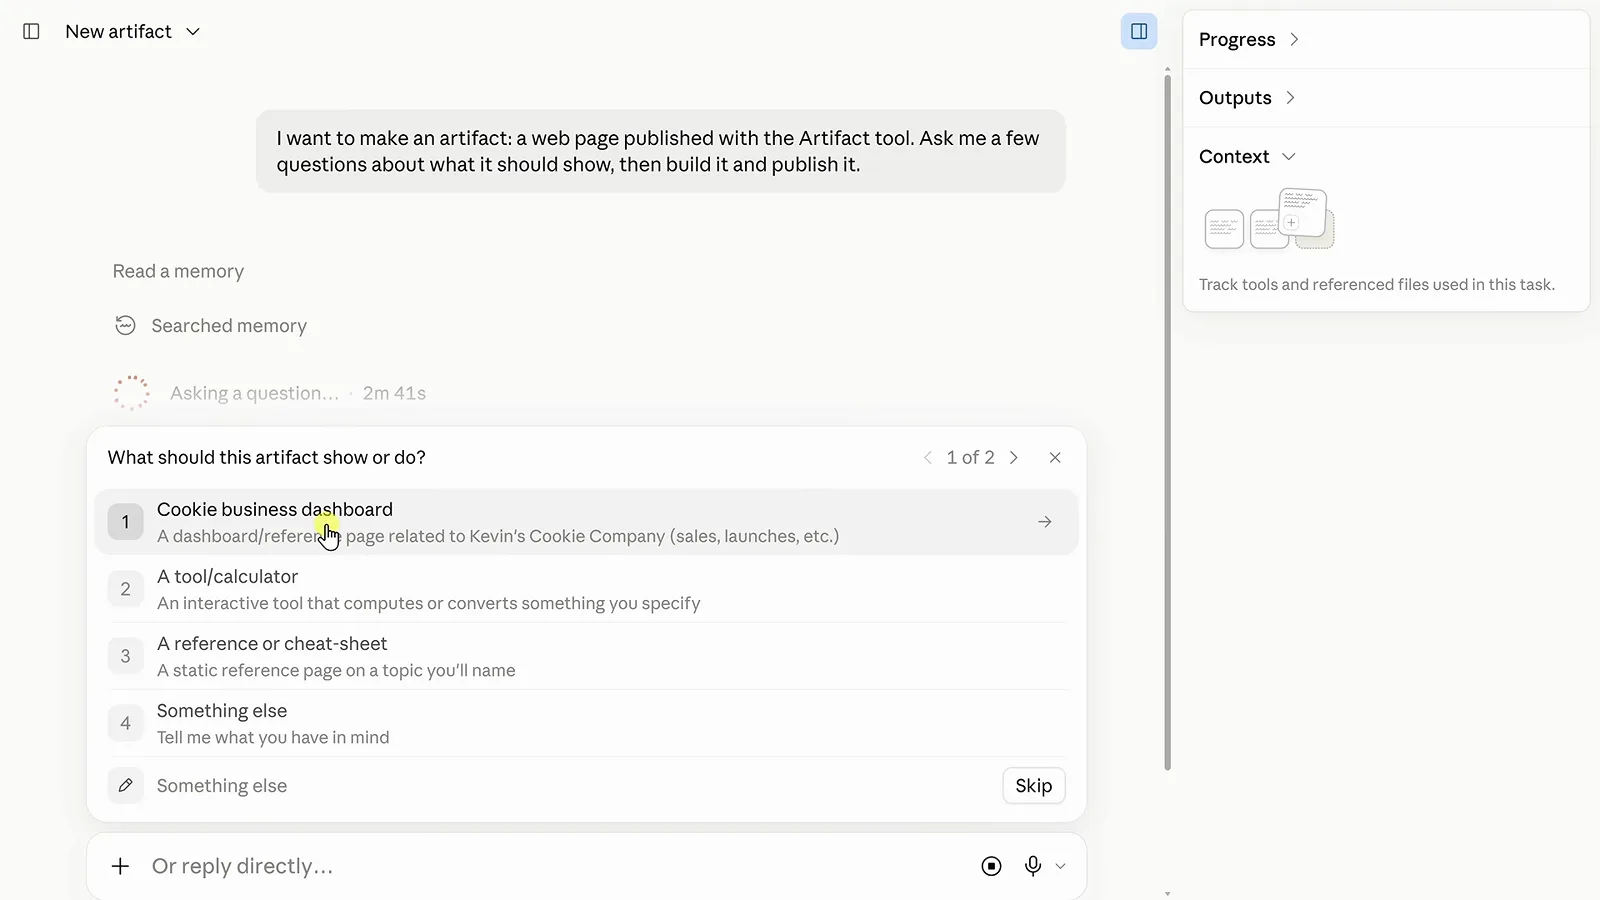
Type, style, focus: these answers steer Claude's first build.Watch at 1:40 - 4
Attach your CSV
When Claude asks where the data should come from, say you'll upload your own. Click the plus icon in the message box, choose Add files or photos (Ctrl U / Cmd U works too), and select your CSV. Claude reviews the columns and decides how to visualize them before building.
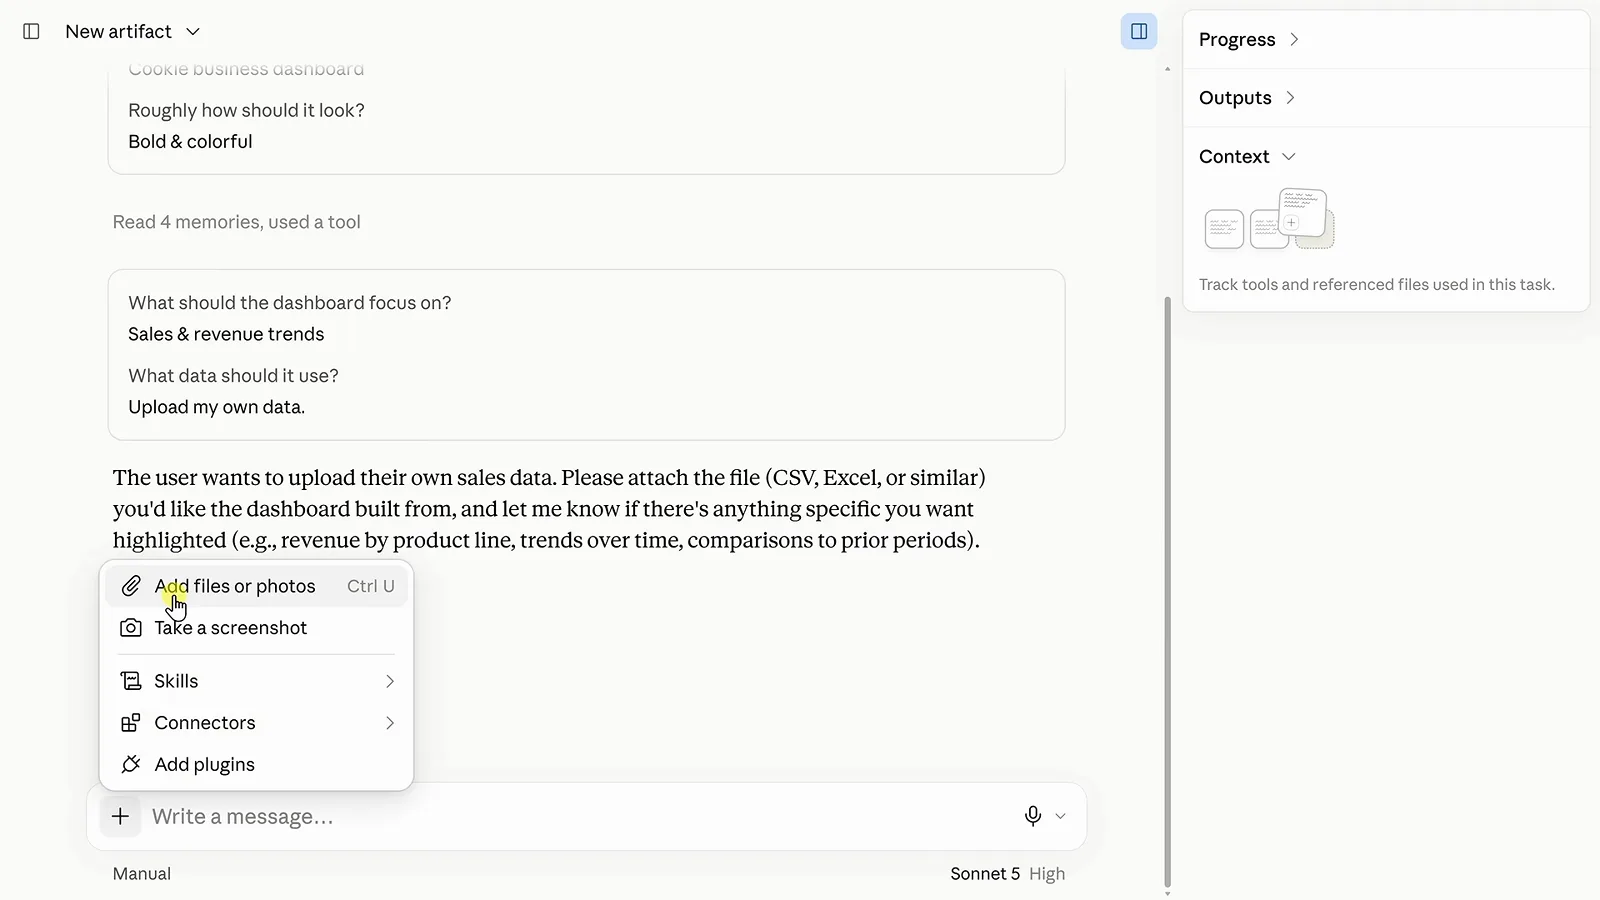
Plus icon → Add files or photos → pick the CSV; Claude studies it before writing any UI.Watch at 2:19 - 5
Publish the first version
A minute or two later Claude publishes the artifact. The dashboard appears on the right — headline metrics across the top, charts underneath — and the chat summarizes what it built: 1,207 orders across 5 flavors and 4 regions, straight from the CSV. Click the expand icon for a better view.
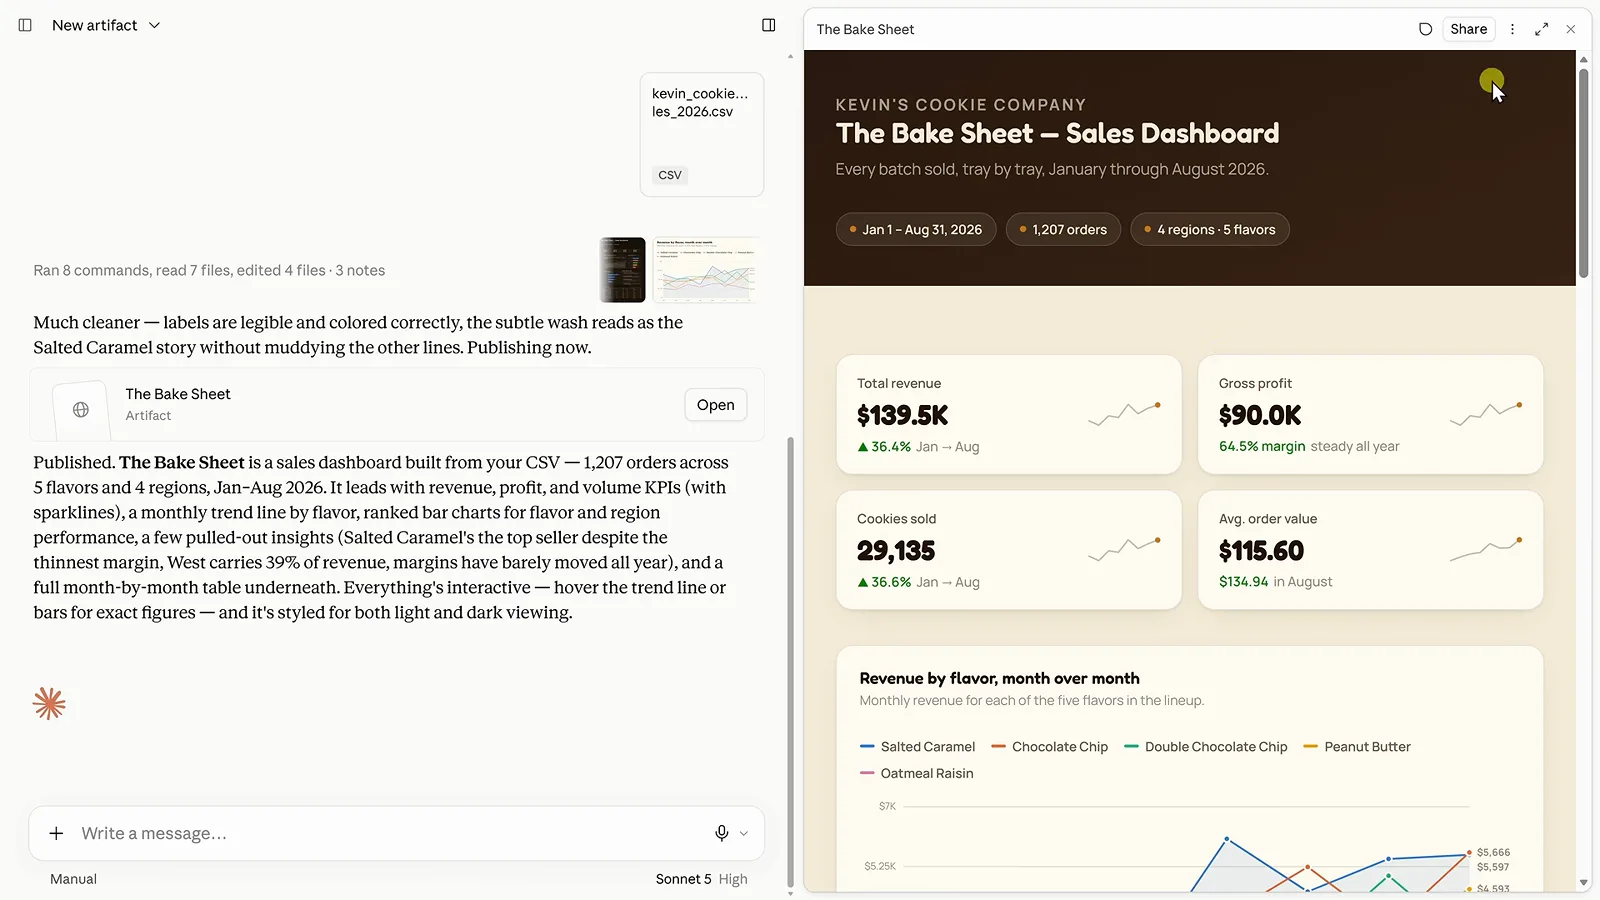
"The Bake Sheet" — KPI cards and charts generated from one uploaded CSV.Watch at 2:42 - 6
Hover the charts for exact figures
This is a real app, not a picture. Run your cursor along the trend line and a tooltip lists the precise revenue for every flavor that month; the bar charts and tables respond the same way. Nobody wrote chart code — Claude built all of it from the file.
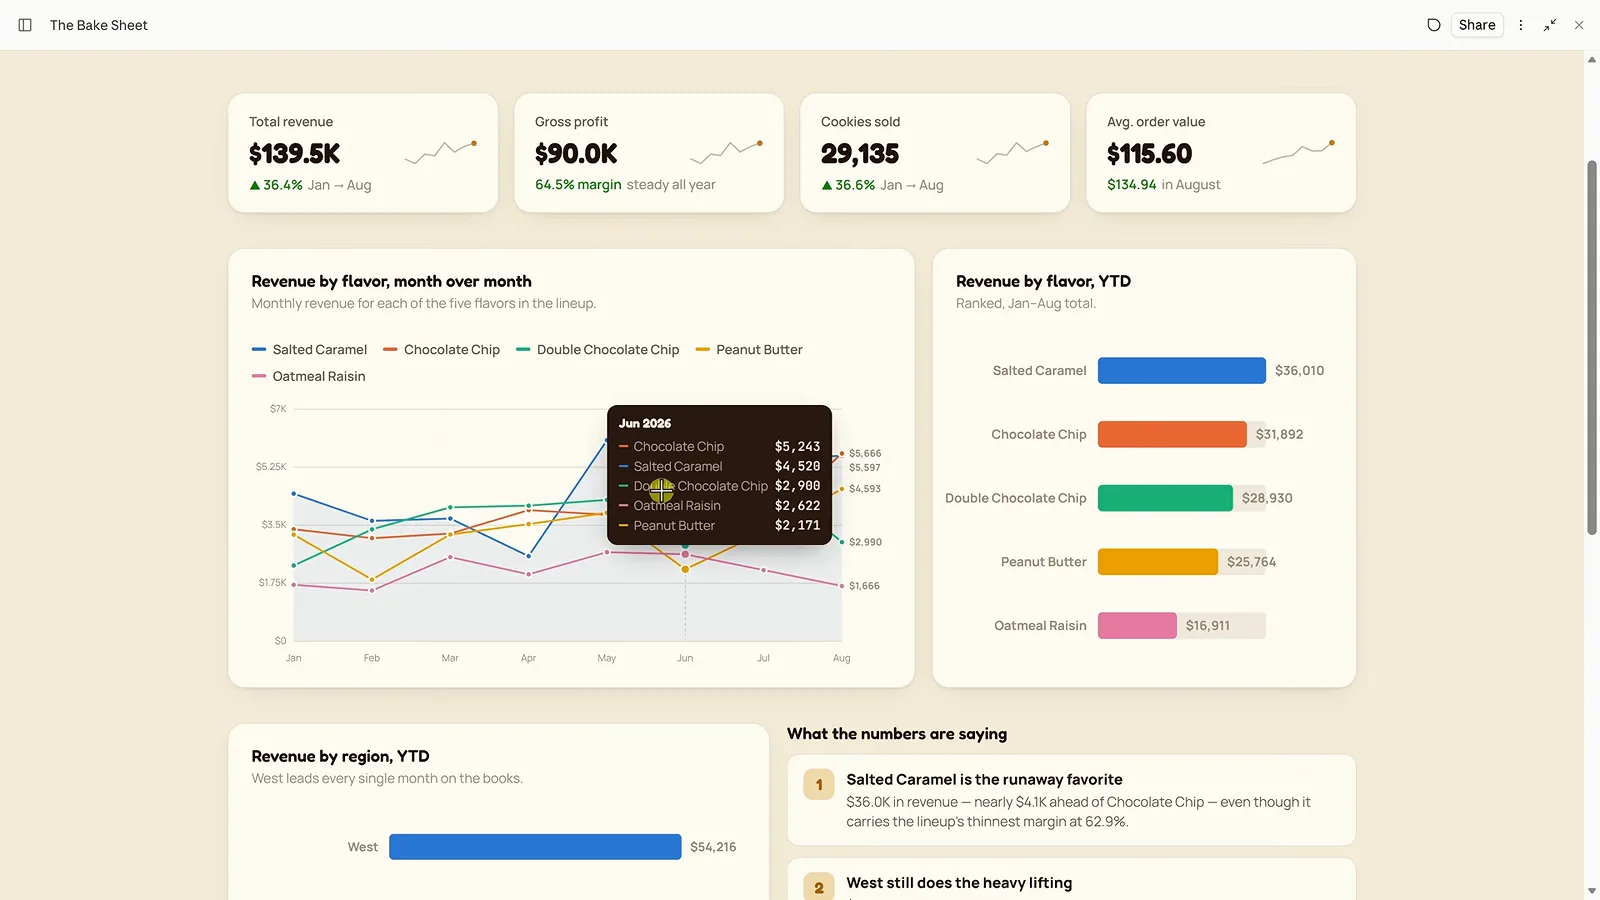
A June tooltip breaks revenue down by flavor — interactive from the first publish.Watch at 2:58 - 7
Refine by chatting, not coding
Don't like something? Just ask. "Add a dark mode toggle to the dashboard" is enough — Claude republishes an updated version with a sun/moon switch in the header that flips the whole theme and remembers your choice. Keep prompting in the same thread for bigger redesigns.
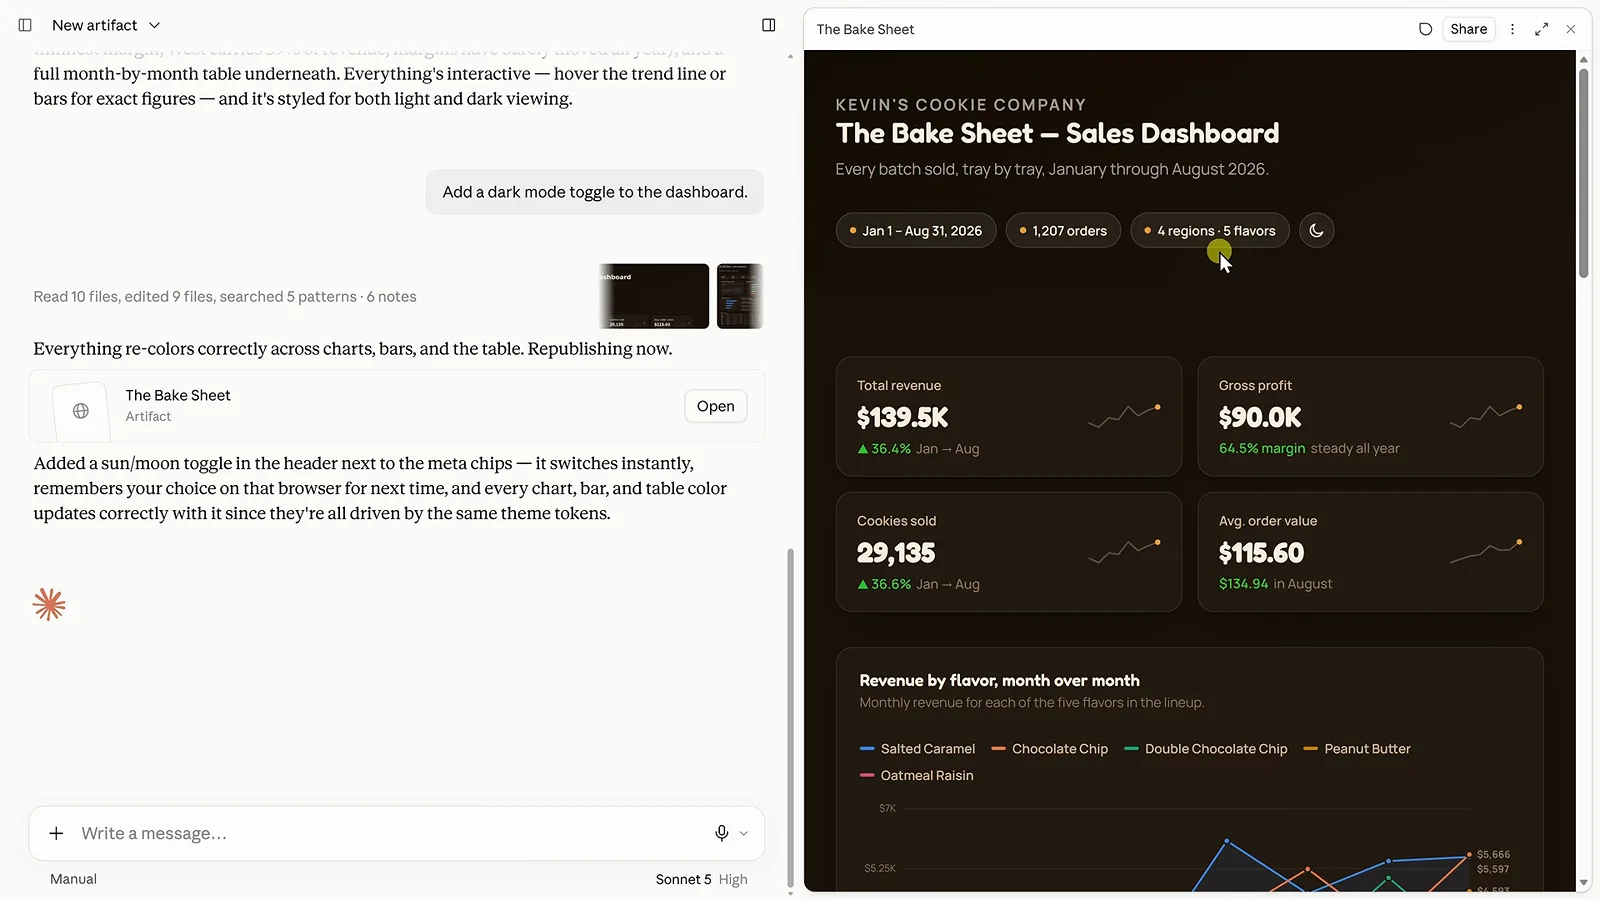
One prompt later: a moon-icon toggle in the header and a full dark theme.Watch at 4:02 - 8
Fix one detail with the annotation tool
To change a single element, open the annotation tool in the artifact's top-right corner and highlight the exact spot — here the "Kevin's Cookie Company" heading. A comment box opens: tell Claude what to change, then either Send to Claude to apply it now, or Add comment to leave the note without touching anything.
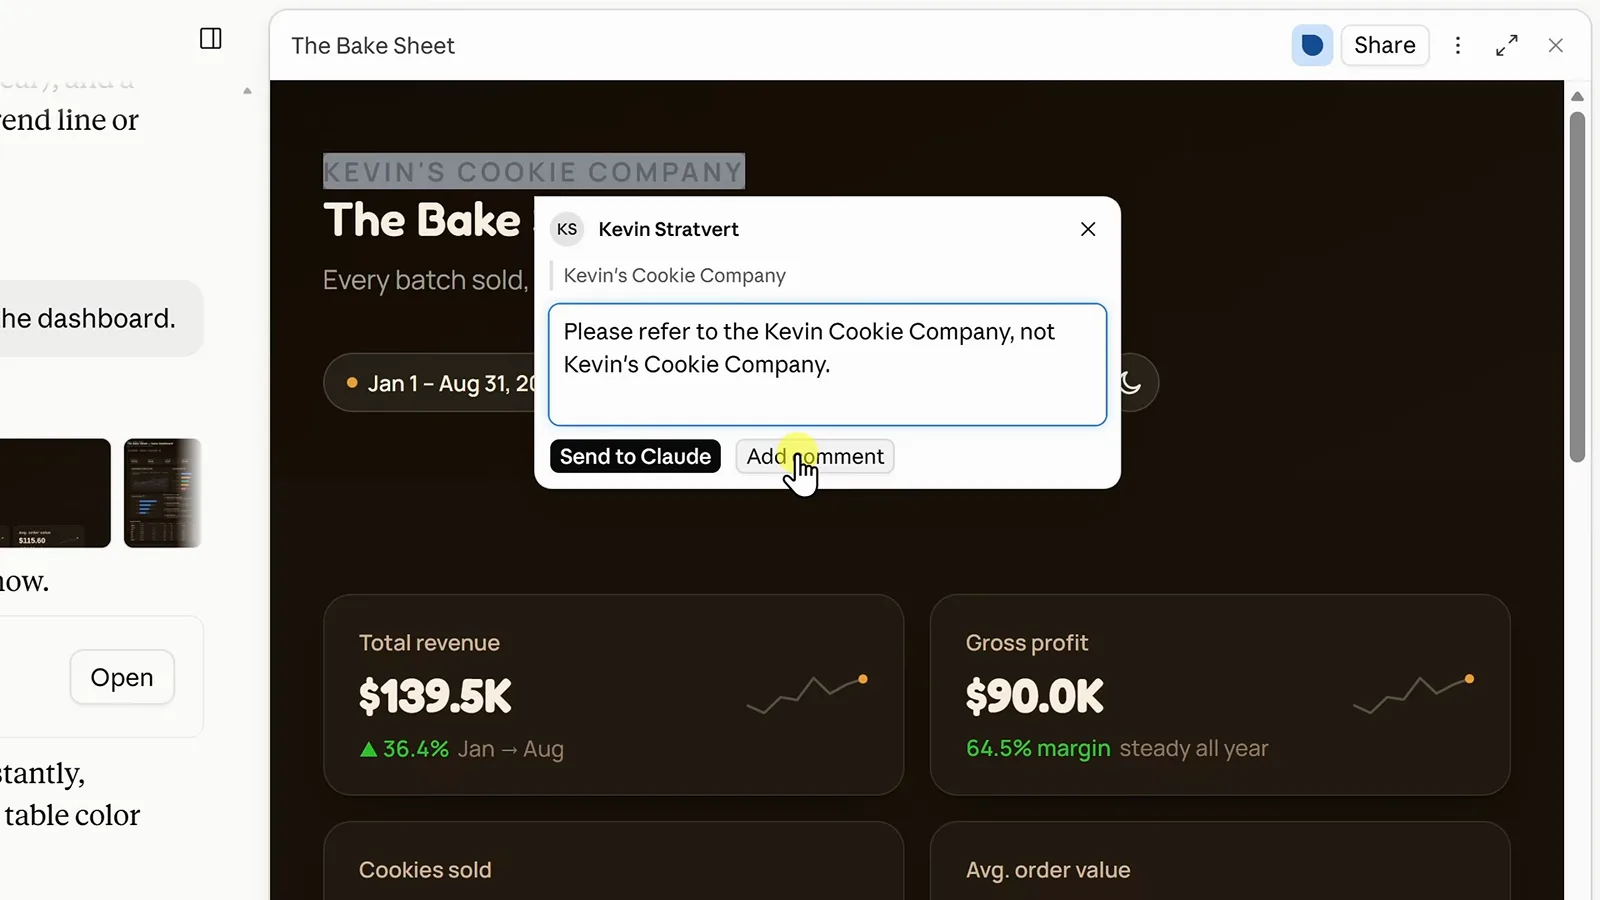
Highlight, write the fix, then apply it — or leave it as a review comment.Watch at 4:50 - 9
Share with anyone who has the link
Click Share, set General access to Anyone with the link, and choose which version to publish — Claude keeps every revision, so you can deliberately share an older snapshot. Copy link hands out a URL where the dashboard runs and stays interactive in any browser.
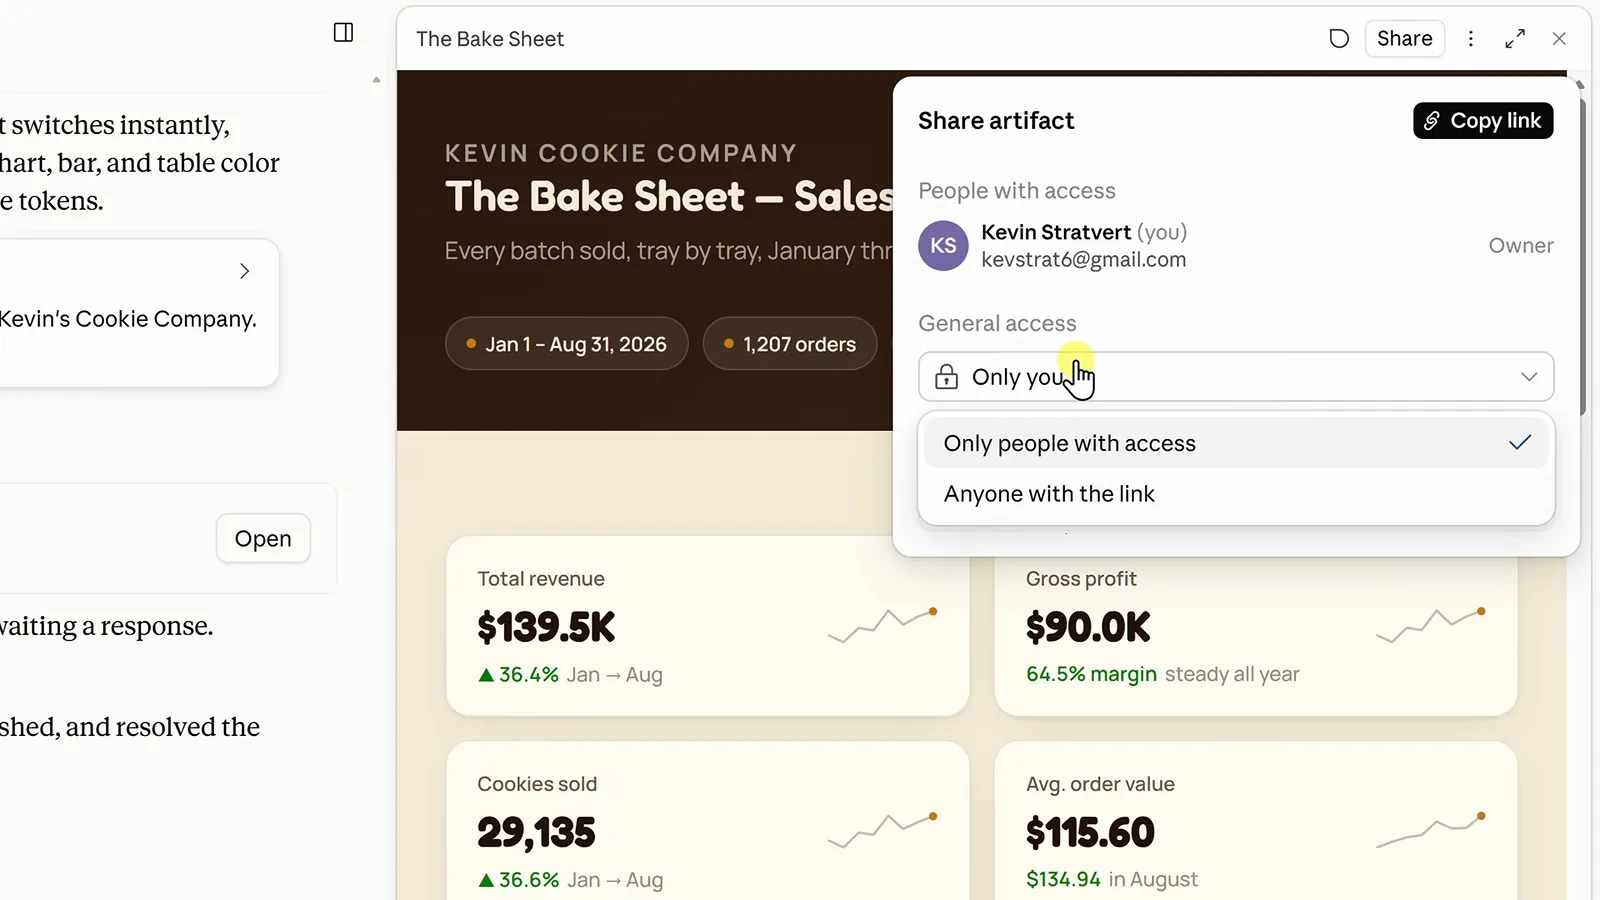
General access → Anyone with the link; the version picker decides what visitors get.Watch at 5:10 - 10
Pin it, and keep the chat for edits
Back in the library, hover the artifact, open its three-dot menu and choose Pin — pinned items collect in a Pinned section for one-click access. To make more changes later, reopen the artifact's original chat from Chat and tasks: that thread is still the artifact's editing room.
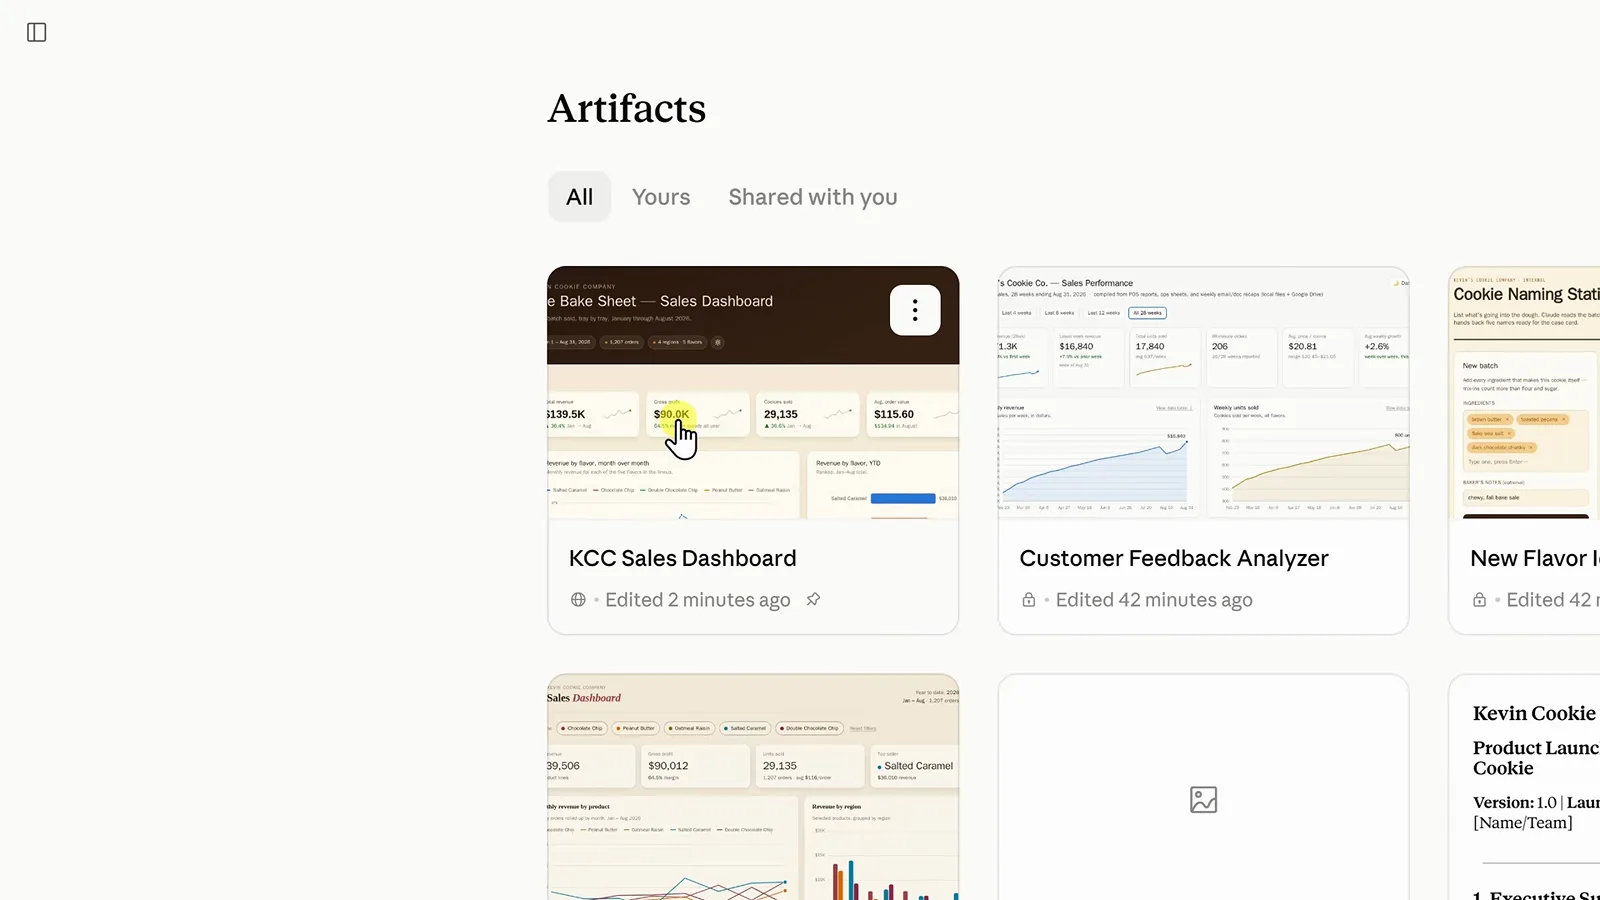
The three-dot menu pins the card; the original chat stays open for future edits.Watch at 5:42
Level up: built-in AI, saved data, connectors, Live Artifacts (steps 11–14)
- 11
Build a tool that uses Claude itself
Artifacts can call Claude directly. Start a new artifact, pick Something else, and describe the tool — here: employees enter cookie ingredients and Claude generates five name ideas. No API key and no backend involved; on first use the artifact simply asks the visitor for permission to reach Claude.
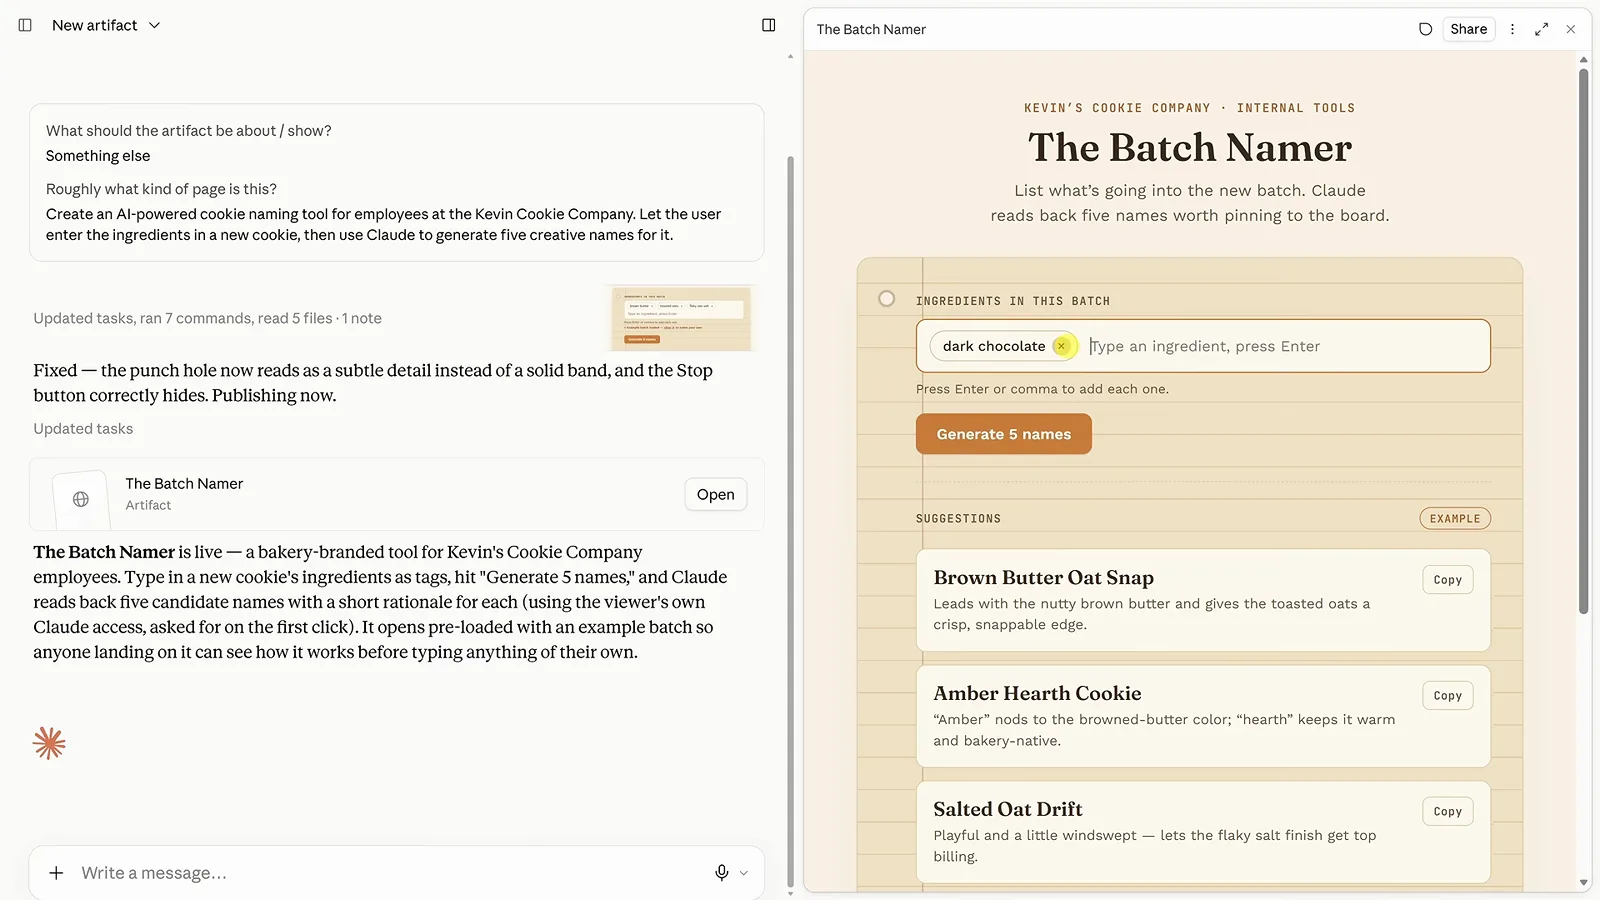
The Batch Namer: type ingredients, hit Generate 5 names, get AI-written candidates.Watch at 7:02 - 12
Make it remember data
Ask Claude to add a favorites feature and it checks one design question first: should saved items be private to this browser, or shared with everyone who opens the artifact? Here we choose shared. Saved ideas then persist — close the tab and the starred names are still there tomorrow. That's the basis for trackers, lists, and light project tools.
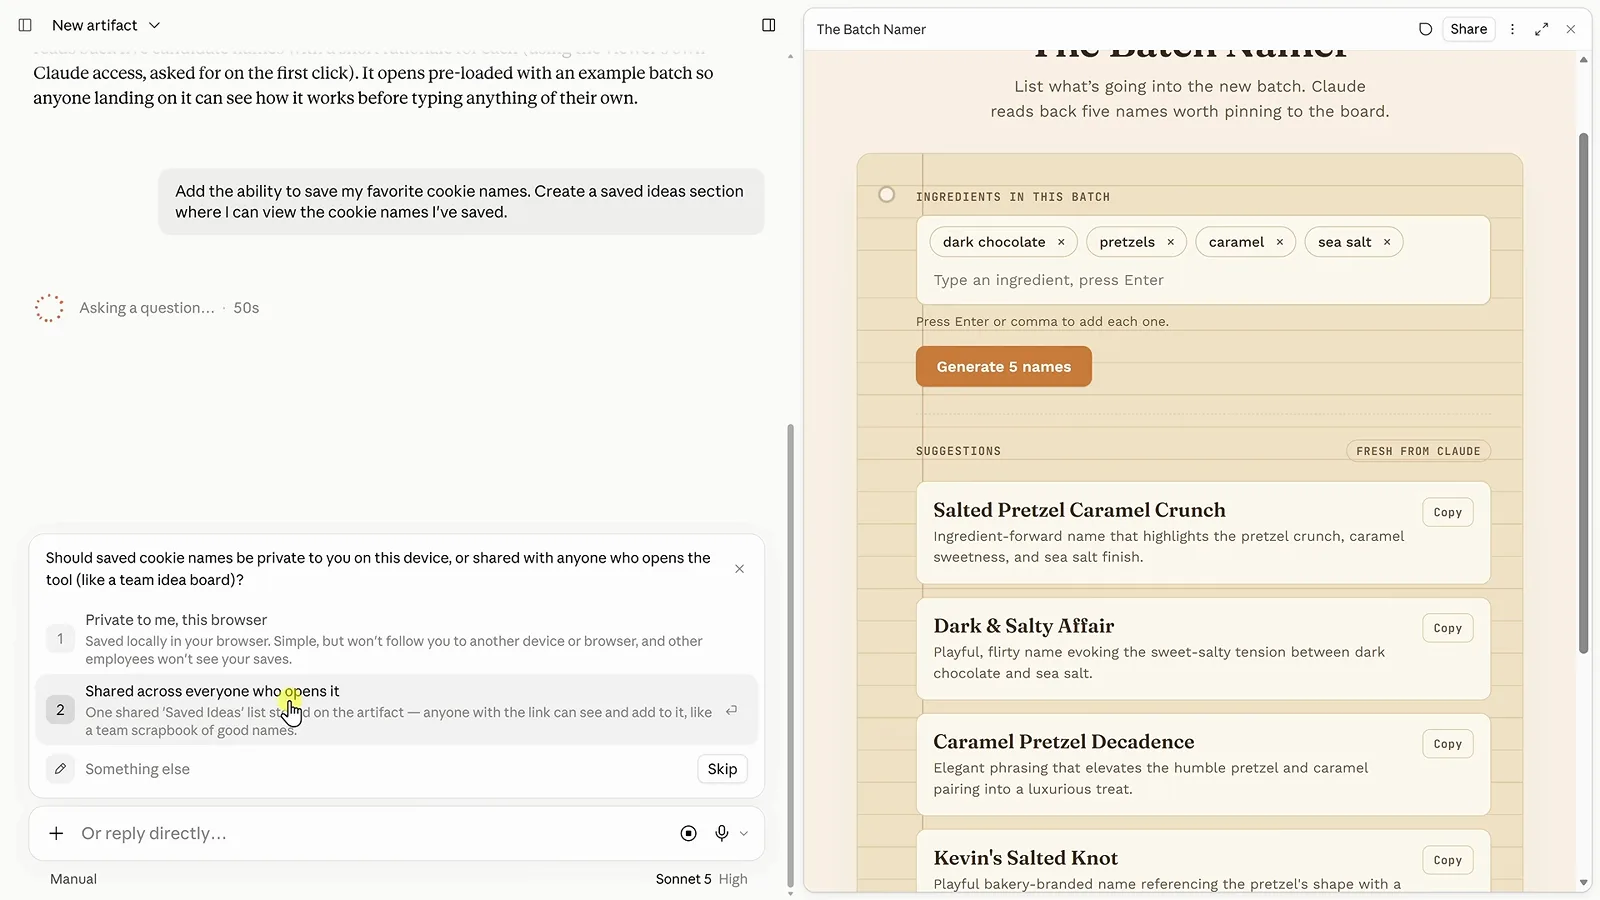
Private or shared saves — then every suggestion gets a star that sticks between sessions.Watch at 8:20 - 13
Connect it to Slack and beyond
Through MCP (Model Context Protocol) connectors, an artifact can act outside Claude. Ask for a share-to-Slack button, approve the Slack connection, pick a channel, and each saved idea gains a button that posts it to the team. Apps without a native connector can still be reached through Zapier MCP — thousands of extra actions.
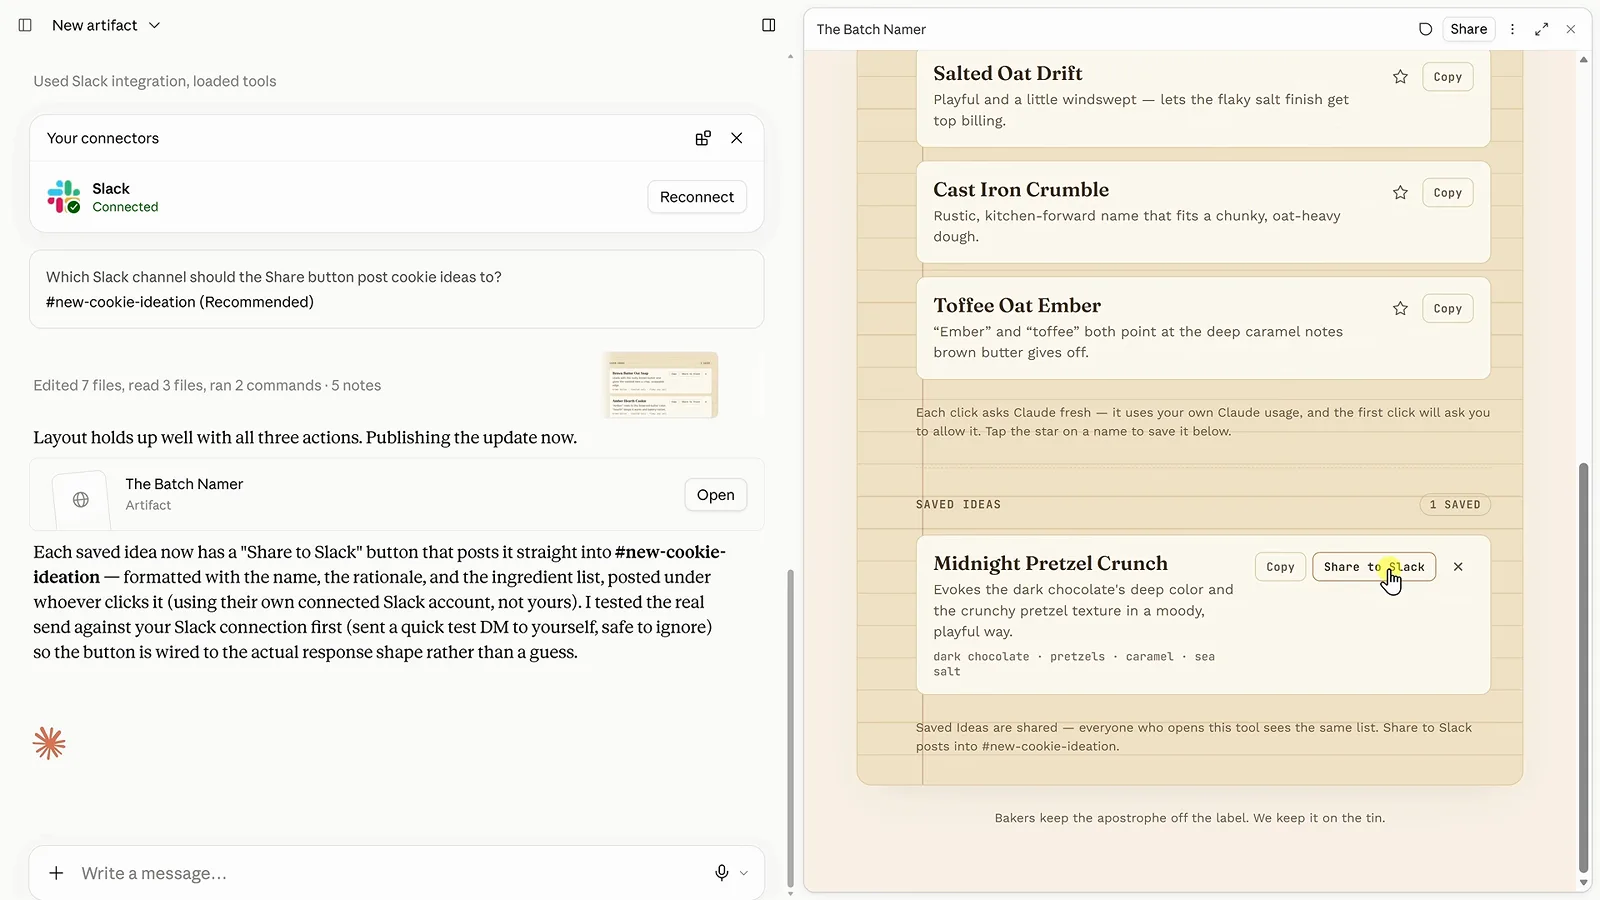
Slack connected: the saved idea now posts itself to #new-cookie-ideation.Watch at 9:40 - 14
Keep it fresh with Live Artifacts
In the Claude desktop app, Live Artifacts pull current data from connected apps and local files instead of a frozen snapshot. This sales dashboard compiles itself from POS reports and Google Drive sheets; press Reload in its header and it redraws with the latest numbers — build once, always open a current view.
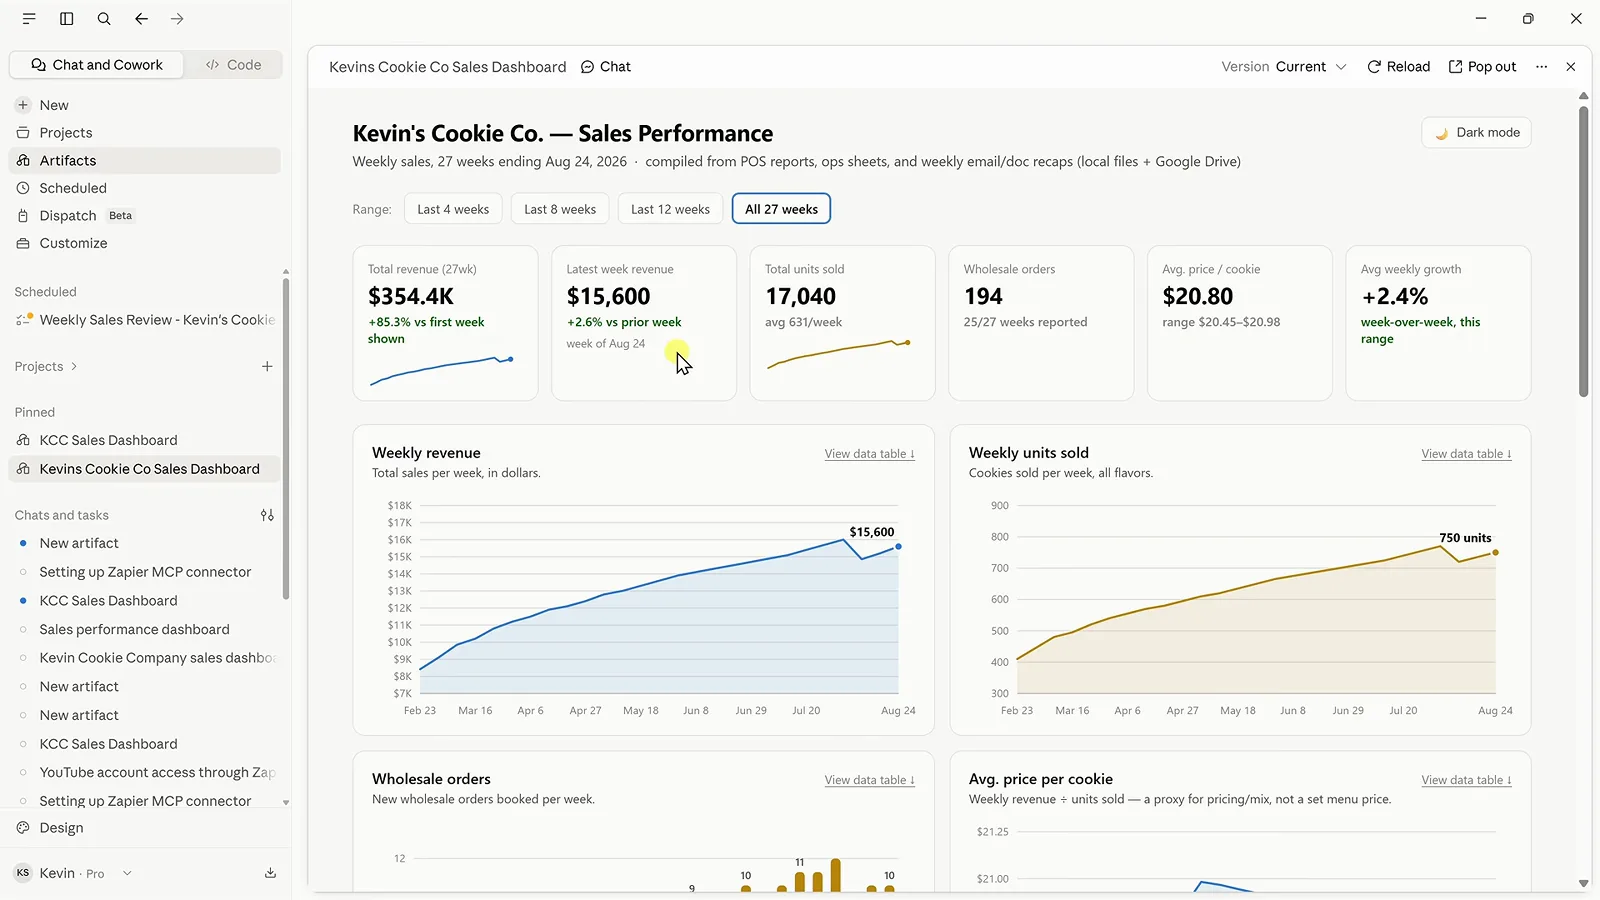
The desktop app's Reload button re-pulls connected data on demand.Watch at 12:04